
Hello friends
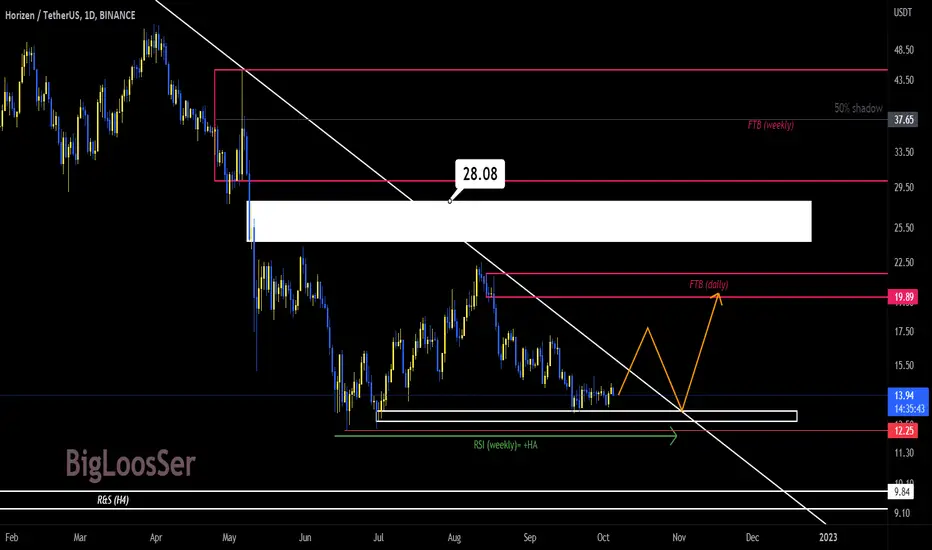
The positive divergence of the RSA in the weekly chart and the downward trend line , which the price is just below, is an interesting combination, isn't it!?
If the $12.25 range is maintained in the current trend and the upward trend is placed above the $17.2 price range, the long-term downward trend line will be broken upwards.
In this case, we can expect an increasing trend in the medium term.
What do you think?

Clause de non-responsabilité
Les informations et publications ne sont pas destinées à être, et ne constituent pas, des conseils ou recommandations financiers, d'investissement, de trading ou autres fournis ou approuvés par TradingView. Pour en savoir plus, consultez les Conditions d'utilisation.
Clause de non-responsabilité
Les informations et publications ne sont pas destinées à être, et ne constituent pas, des conseils ou recommandations financiers, d'investissement, de trading ou autres fournis ou approuvés par TradingView. Pour en savoir plus, consultez les Conditions d'utilisation.