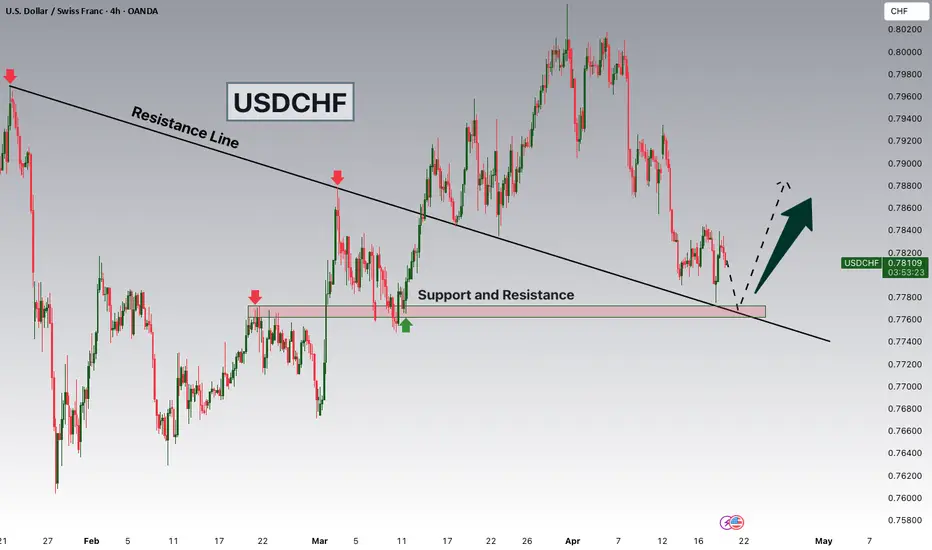
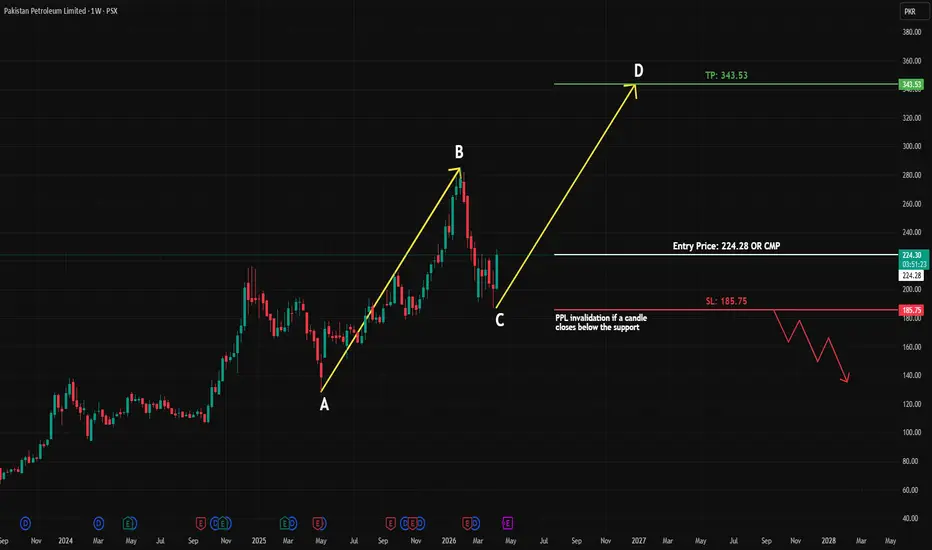
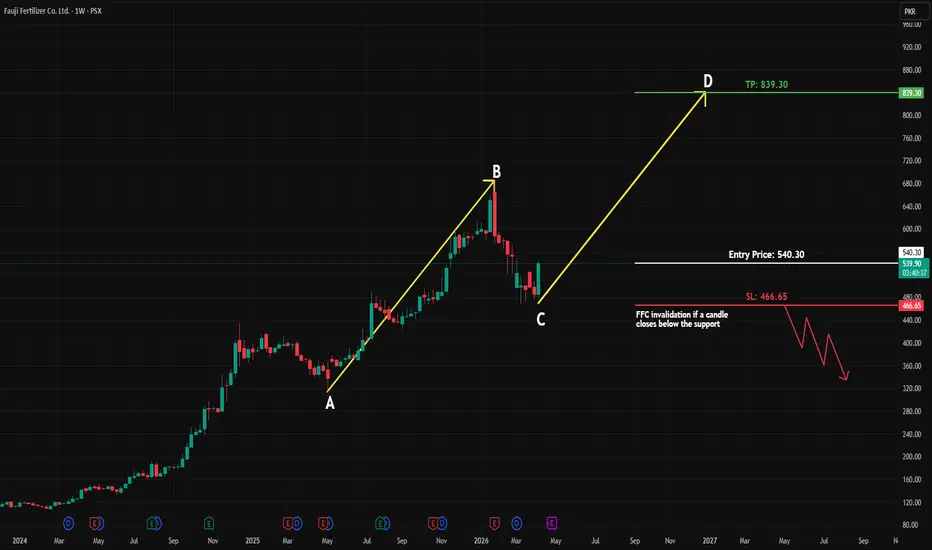
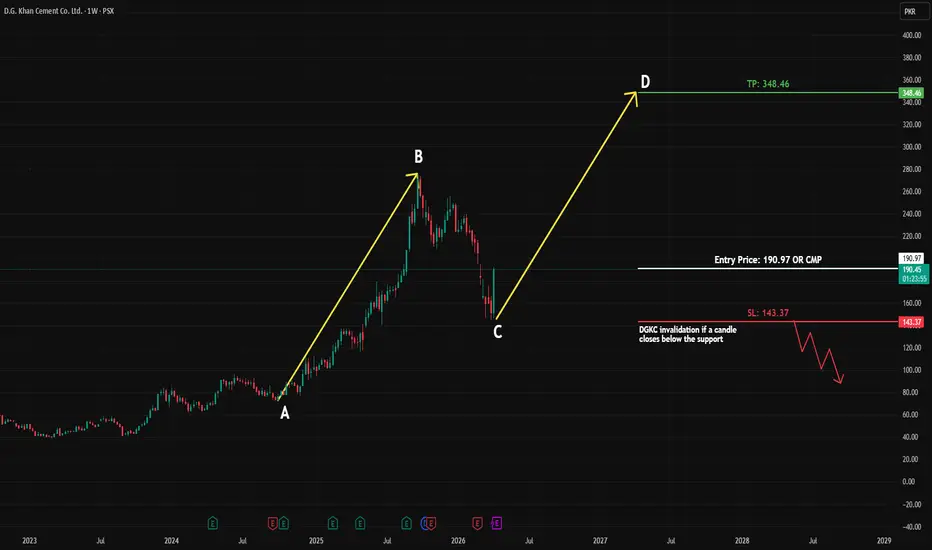
Long
Long
 Long
Long
BTCUSD : Breaking freeBittcoin is currently exhibiting a historically unusual market dynamic: prices are stabilizing and beginning to rise while volatility (as measured by DVOL) remains low and is falling. This decoupling of price from explosive volatility marks a structural break from past cycles.
The Core Insight: This phenomenon strongly suggests that the "panic" phase of the recent sell-off has ended with a price bottom near $60,000. The market has not entered a speculative mania but has transitioned into a professional, institutionally-driven environment where price appreciation is steady rather than erratic
The shift from volatility to stability is being led by sophisticated, deep-pocketed institutions. The "smart money" has replaced retail FOMO as the primary driver.
Asset Managers (BlackRock): BlackRock’s IBIT spot Bitcoin ETF now accounts for a record 52% of all Bitcoin options open interest. This is the single most important player, as its massive scale allows for professional hedging strategies that directly dampen price swings.
Crypto-Native Institutions (Deribit & Market Makers): Deribit remains the dominant venue (76% market share), but its activity is now 80% institutional, a stark reversal from its retail-dominated past . These players use covered calls and puts to generate yield and manage risk, mechanically smoothing out price action.
Corporate Treasuries (Strategy): Firms like Strategy (formerly MicroStrategy) continue to accumulate Bitcoin as a long-term treasury asset, providing consistent, non-speculative buy-side pressure that absorbs selling volume.
Hedgers (Miners & Funds): Bitcoin miners and large funds are actively using the options market to lock in future prices (hedge) rather than liquidating holdings during dips, which prevents cascading sell-offs
The consensus from institutional analysis points to a "slow grind higher" in the near term, followed by a faster acceleration in late 2026/early 2027. The old "4-year halving cycle" is considered broken; the new cycle is driven by liquidity and institutional demand.
Short-Term (Next 1-4 Months): Expect a slow and steady climb with low volatility. The market is building a base. A sustained break above the psychological $80,000 resistance level is the key technical signal needed to confirm the next leg up.
Medium-Term (6-12 Months): As institutions roll their options positions to higher strike prices (e.g., from $100k to $120k), the "ceiling" on price will move up, allowing for a gradual rise toward the $100,000 - $150,000 range
The "falling DVOL, rising price" environment is the signature of a maturing, institutional market. The next 12 months are likely to be characterized by a "slow then fast" trajectory—a patient, stable climb through 2026, followed by an acceleration toward new all-time highs in 2027 as the full weight of institutional capital flows into the market.
Good luck  Long
Long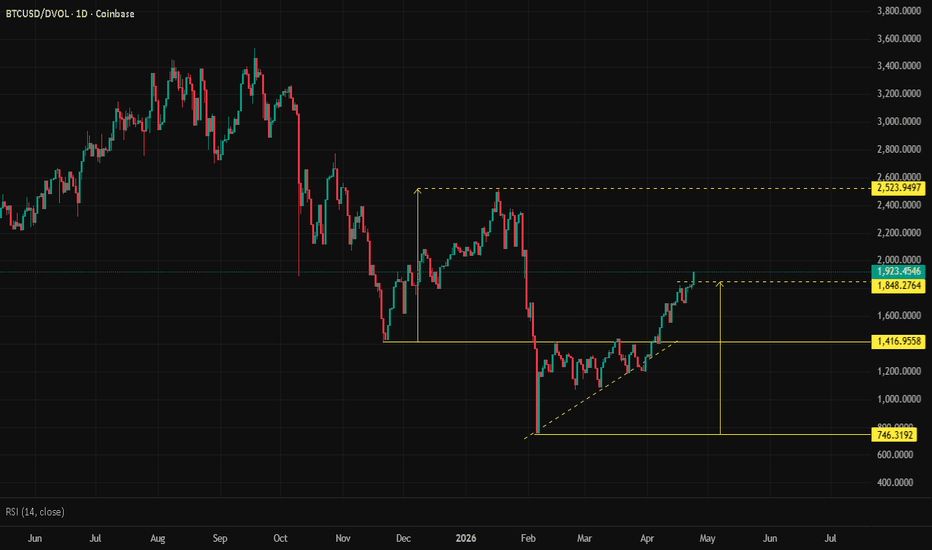
Short 
Ethereum Hits Record Transaction Surge In Q1 2026Ethereum just delivered one of its strongest quarters ever. The network processed over 200 million transactions in Q1 2026. This milestone marks a historic leap in activity. It reflects a sharp rise in real-world usage across the ecosystem.
The Ethereum transactions surge stands out because it happened despite a slow price trend. Many expected price growth to follow usage. That did not happen this time. Instead, network fundamentals strengthened quietly in the background.
Developers, traders, and users continue to build and transact on Ethereum daily. This steady activity reveals deeper adoption trends. It shows that the ecosystem grows beyond speculation. The numbers now confirm a shift toward utility-driven growth.
Ethereum Network Usage Reaches New Highs
The Ethereum network usage crossed 200 million transactions in just one quarter. This jump represents around 43 percent growth compared to the previous quarter. Such acceleration signals strong demand across multiple sectors.
Users now rely on Ethereum for payments, DeFi, NFTs, and infrastructure. The Ethereum transactions surge reflects this diversity. It highlights how different applications drive continuous engagement.
More importantly, this growth did not come from one single trend. Instead, multiple sectors contributed simultaneously. That creates a stronger and more sustainable growth pattern.
Layer 2 Scaling Drives Massive Efficiency Gains
Layer 2 scaling played a major role in this expansion. Solutions like rollups reduce transaction costs and improve speed. They allow users to interact with Ethereum without paying high gas fees.
The rise of Layer 2 scaling unlocked new user segments. Smaller transactions became viable again. Developers built applications that require frequent interactions. This naturally increased overall transaction count.
As Layer 2 scaling continues to evolve, Ethereum benefits from increased throughput. The Ethereum transactions surge reflects this improved efficiency. It shows how scaling solutions transform user behavior.
Many users now interact with Ethereum through Layer 2 networks. These networks settle transactions on the main chain. That keeps security intact while boosting capacity.
Stablecoin Activity Fuels Daily Transactions
Stablecoin activity remains another key driver behind this growth. Users rely on stablecoins for payments, trading, and remittances. These assets maintain consistent value, making them ideal for frequent transactions. The Ethereum network hosts a large portion of global stablecoin supply. This dominance strengthens Ethereum network usage. It ensures continuous transaction flow across the ecosystem.
Traders move funds between exchanges using stablecoins. Businesses use them for cross-border payments. DeFi platforms depend on them for liquidity. All these actions contribute to the Ethereum transactions surge. Stablecoin activity also increases network stickiness. Users return frequently to transact. That creates consistent demand rather than one-time spikes.
What This Means For Ethereum’s Future
The current trend points toward sustainable growth. Ethereum continues to attract developers and users across sectors. The combination of Layer 2 scaling and stablecoin activity strengthens its foundation. The Ethereum transactions surge signals a shift from hype-driven cycles to utility-driven adoption. That shift matters for long-term stability. It reduces reliance on speculative demand.
If Ethereum maintains this trajectory, it could dominate as the base layer for decentralized applications. Increased Ethereum network usage supports this vision. It shows real engagement rather than temporary spikes. At the same time, scaling improvements will remain crucial. Developers must continue optimizing performance. Users expect faster and cheaper transactions.
The Bigger Picture Behind The Numbers
This record quarter tells a larger story. ETH evolves into a high-utility blockchain. It supports financial systems, digital ownership, and decentralized infrastructure. The Ethereum transactions surge reflects this transformation clearly. It shows how real-world applications drive adoption. It also highlights the success of scaling strategies. As more users enter the ecosystem, network effects strengthen further. Each new participant adds value to the system. That creates a compounding growth cycle.  Short
Short
 Long
Long
 Long
Long
 Long
Long
 Long
Long
 Long
Long
 Long
Long
 Long
Long
 Long
Long
 Short
Short

 Long
Long Long
Long

 Long
Long