AB=CD
EURCAD Bullish Setup | AB=CD Pattern & Higher Low Formation#EURCAD is currently trading in a healthy correction phase after forming clear Higher Highs (HHs), maintaining an overall bullish market structure.
On the 1D timeframe, price action indicates a high-probability AB=CD harmonic pattern. The C leg of the pattern has already formed, and the price is now positioned within a strong demand zone, suggesting a potential Higher Low (HL).
Key Factors Supporting the Setup:
Bullish market structure (HH → HL continuation)
AB=CD pattern development
Price reacting from a key demand zone
No strong bearish confirmation at this stage
Trade Plan:
Entry: Current Market Price (CMP) or after lower timeframe confirmation
Stop Loss: Below the recent swing low
Targets: Previous highs and Fibonacci extension levels
Proper risk management is essential. Wait for confirmation before entering and manage your position accordingly.
If this setup holds, #EURCAD may continue its bullish move in line with the prevailing trend.
What is your view on #EURCAD? Share your analysis.
Follow for more high-probability trading setups.
#EURCAD #ForexTrading #TechnicalAnalysis #PriceAction #HarmonicPattern #ABCDPattern #SwingTrading #RiskManagement
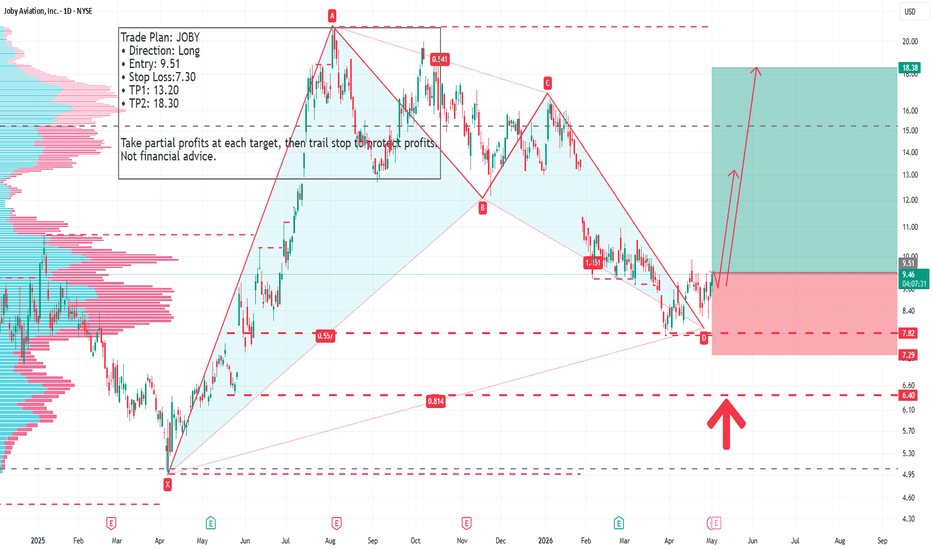
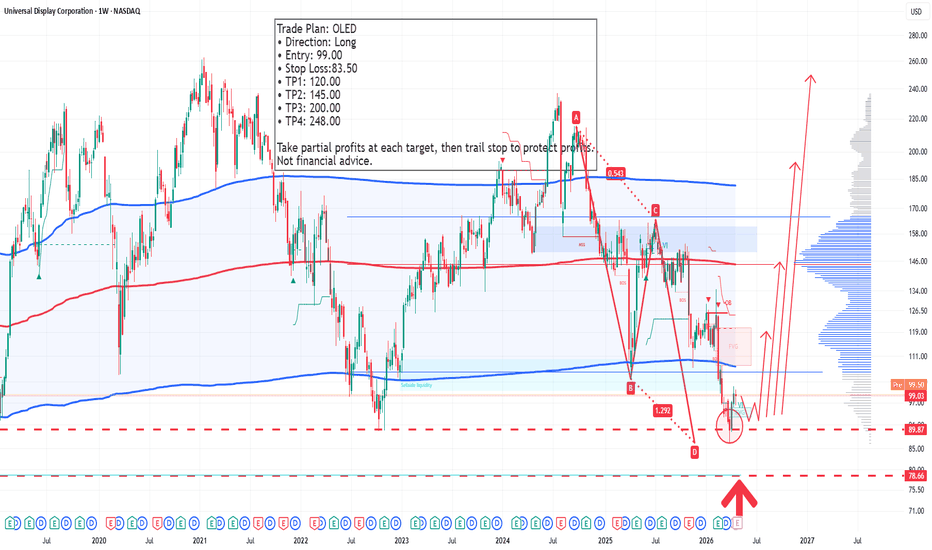
Trade Plan: EURUSDTrade Plan: EURUSD
• Direction: Short
• Entry: 1.16940
• Stop Loss: 1.17500
• TP1: 1.16168
• TP2: 1.15460
• TP3: 1.14666
Take partial profits at each target, then trail stop to protect profits.
Analysis based on market structure, volume profile and harmonic pattern.
Not financial advice.
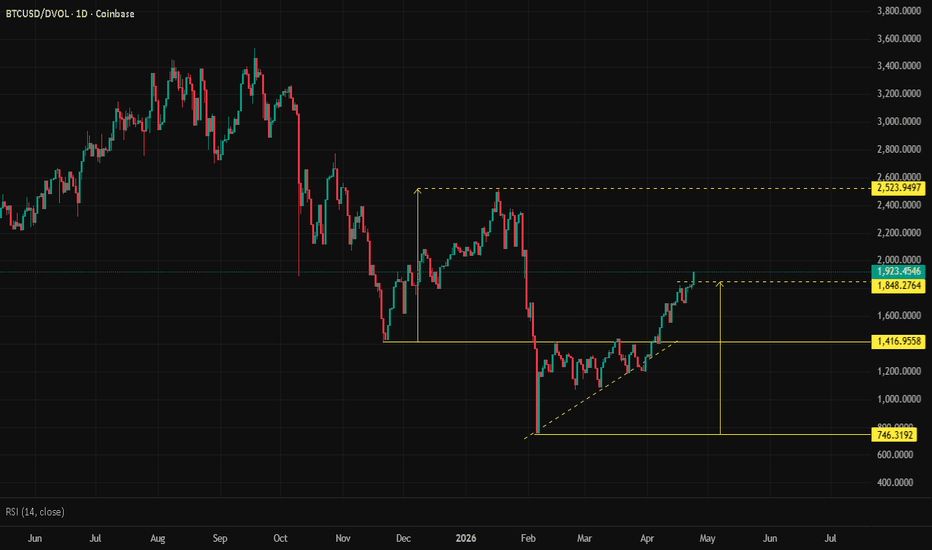
BTCUSD : Breaking freeBittcoin is currently exhibiting a historically unusual market dynamic: prices are stabilizing and beginning to rise while volatility (as measured by DVOL) remains low and is falling. This decoupling of price from explosive volatility marks a structural break from past cycles.
The Core Insight: This phenomenon strongly suggests that the "panic" phase of the recent sell-off has ended with a price bottom near $60,000. The market has not entered a speculative mania but has transitioned into a professional, institutionally-driven environment where price appreciation is steady rather than erratic
The shift from volatility to stability is being led by sophisticated, deep-pocketed institutions. The "smart money" has replaced retail FOMO as the primary driver.
Asset Managers (BlackRock): BlackRock’s IBIT spot Bitcoin ETF now accounts for a record 52% of all Bitcoin options open interest. This is the single most important player, as its massive scale allows for professional hedging strategies that directly dampen price swings.
Crypto-Native Institutions (Deribit & Market Makers): Deribit remains the dominant venue (76% market share), but its activity is now 80% institutional, a stark reversal from its retail-dominated past . These players use covered calls and puts to generate yield and manage risk, mechanically smoothing out price action.
Corporate Treasuries (Strategy): Firms like Strategy (formerly MicroStrategy) continue to accumulate Bitcoin as a long-term treasury asset, providing consistent, non-speculative buy-side pressure that absorbs selling volume.
Hedgers (Miners & Funds): Bitcoin miners and large funds are actively using the options market to lock in future prices (hedge) rather than liquidating holdings during dips, which prevents cascading sell-offs
The consensus from institutional analysis points to a "slow grind higher" in the near term, followed by a faster acceleration in late 2026/early 2027. The old "4-year halving cycle" is considered broken; the new cycle is driven by liquidity and institutional demand.
Short-Term (Next 1-4 Months): Expect a slow and steady climb with low volatility. The market is building a base. A sustained break above the psychological $80,000 resistance level is the key technical signal needed to confirm the next leg up.
Medium-Term (6-12 Months): As institutions roll their options positions to higher strike prices (e.g., from $100k to $120k), the "ceiling" on price will move up, allowing for a gradual rise toward the $100,000 - $150,000 range
The "falling DVOL, rising price" environment is the signature of a maturing, institutional market. The next 12 months are likely to be characterized by a "slow then fast" trajectory—a patient, stable climb through 2026, followed by an acceleration toward new all-time highs in 2027 as the full weight of institutional capital flows into the market.
Good luck
Thoughts on EURUSDGood afternoon,
The market for EURUSD is looking at a retracement for going bearish in 4H and it was confirmed after a diamond pattern that hasn't reached yet the TP at 1.16631 approximately. The diamond pattern means change in the trend when in 30M has been somewhat bullish and consolidated until the appearance of the pattern. However, a ABCD pattern showed and bounced exactly as predicted at a fibonacci retracement and extension of 0.5:2.0 which is peculiar pair. This gives an opportunity for a bullish position until price 1.1744. The entrance will at 1.16631 (not reached yet) and waiting for candle confirmation.
Link:
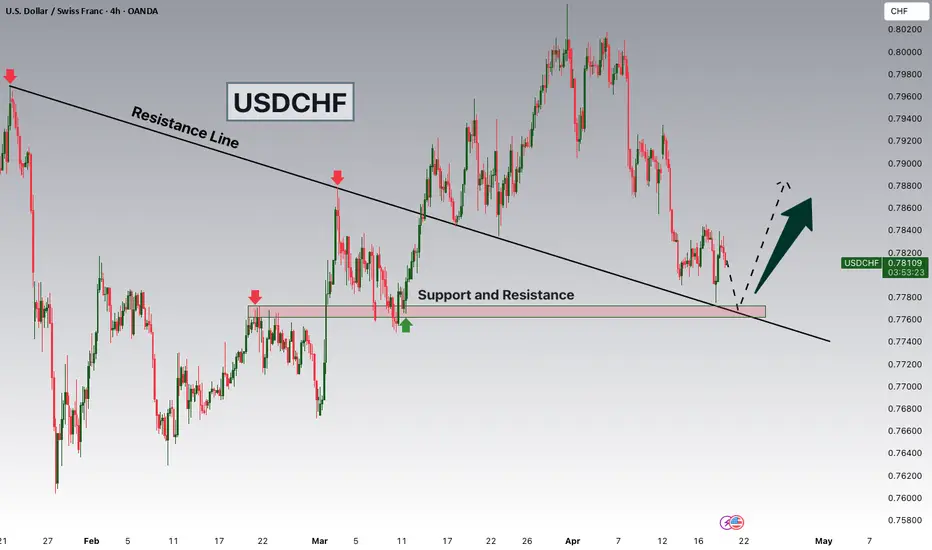
USDCHF Breakout and Potential Retrace!Hey Traders, in today's trading session we are monitoring USDCHF for a buying opportunity around 0.77700 zone, USDCHF was trading in a downtrend and successfully managed to break it out. Currently is in a correction phase in which it is approaching the retrace area at 0.77700 support and resistance area.
Trade safe, Joe.
Ethereum Hits Record Transaction Surge In Q1 2026Ethereum just delivered one of its strongest quarters ever. The network processed over 200 million transactions in Q1 2026. This milestone marks a historic leap in activity. It reflects a sharp rise in real-world usage across the ecosystem.
The Ethereum transactions surge stands out because it happened despite a slow price trend. Many expected price growth to follow usage. That did not happen this time. Instead, network fundamentals strengthened quietly in the background.
Developers, traders, and users continue to build and transact on Ethereum daily. This steady activity reveals deeper adoption trends. It shows that the ecosystem grows beyond speculation. The numbers now confirm a shift toward utility-driven growth.
Ethereum Network Usage Reaches New Highs
The Ethereum network usage crossed 200 million transactions in just one quarter. This jump represents around 43 percent growth compared to the previous quarter. Such acceleration signals strong demand across multiple sectors.
Users now rely on Ethereum for payments, DeFi, NFTs, and infrastructure. The Ethereum transactions surge reflects this diversity. It highlights how different applications drive continuous engagement.
More importantly, this growth did not come from one single trend. Instead, multiple sectors contributed simultaneously. That creates a stronger and more sustainable growth pattern.
Layer 2 Scaling Drives Massive Efficiency Gains
Layer 2 scaling played a major role in this expansion. Solutions like rollups reduce transaction costs and improve speed. They allow users to interact with Ethereum without paying high gas fees.
The rise of Layer 2 scaling unlocked new user segments. Smaller transactions became viable again. Developers built applications that require frequent interactions. This naturally increased overall transaction count.
As Layer 2 scaling continues to evolve, Ethereum benefits from increased throughput. The Ethereum transactions surge reflects this improved efficiency. It shows how scaling solutions transform user behavior.
Many users now interact with Ethereum through Layer 2 networks. These networks settle transactions on the main chain. That keeps security intact while boosting capacity.
Stablecoin Activity Fuels Daily Transactions
Stablecoin activity remains another key driver behind this growth. Users rely on stablecoins for payments, trading, and remittances. These assets maintain consistent value, making them ideal for frequent transactions. The Ethereum network hosts a large portion of global stablecoin supply. This dominance strengthens Ethereum network usage. It ensures continuous transaction flow across the ecosystem.
Traders move funds between exchanges using stablecoins. Businesses use them for cross-border payments. DeFi platforms depend on them for liquidity. All these actions contribute to the Ethereum transactions surge. Stablecoin activity also increases network stickiness. Users return frequently to transact. That creates consistent demand rather than one-time spikes.
What This Means For Ethereum’s Future
The current trend points toward sustainable growth. Ethereum continues to attract developers and users across sectors. The combination of Layer 2 scaling and stablecoin activity strengthens its foundation. The Ethereum transactions surge signals a shift from hype-driven cycles to utility-driven adoption. That shift matters for long-term stability. It reduces reliance on speculative demand.
If Ethereum maintains this trajectory, it could dominate as the base layer for decentralized applications. Increased Ethereum network usage supports this vision. It shows real engagement rather than temporary spikes. At the same time, scaling improvements will remain crucial. Developers must continue optimizing performance. Users expect faster and cheaper transactions.
The Bigger Picture Behind The Numbers
This record quarter tells a larger story. ETH evolves into a high-utility blockchain. It supports financial systems, digital ownership, and decentralized infrastructure. The Ethereum transactions surge reflects this transformation clearly. It shows how real-world applications drive adoption. It also highlights the success of scaling strategies. As more users enter the ecosystem, network effects strengthen further. Each new participant adds value to the system. That creates a compounding growth cycle.
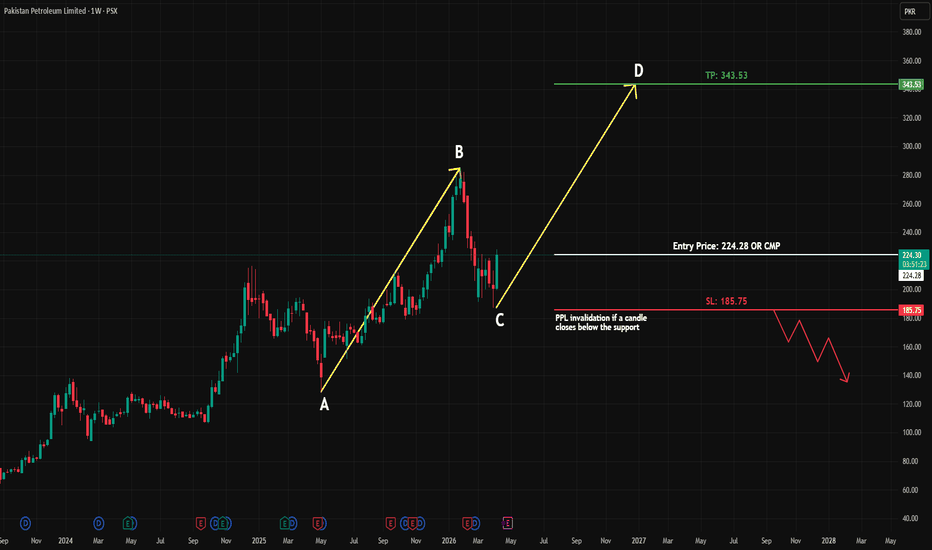
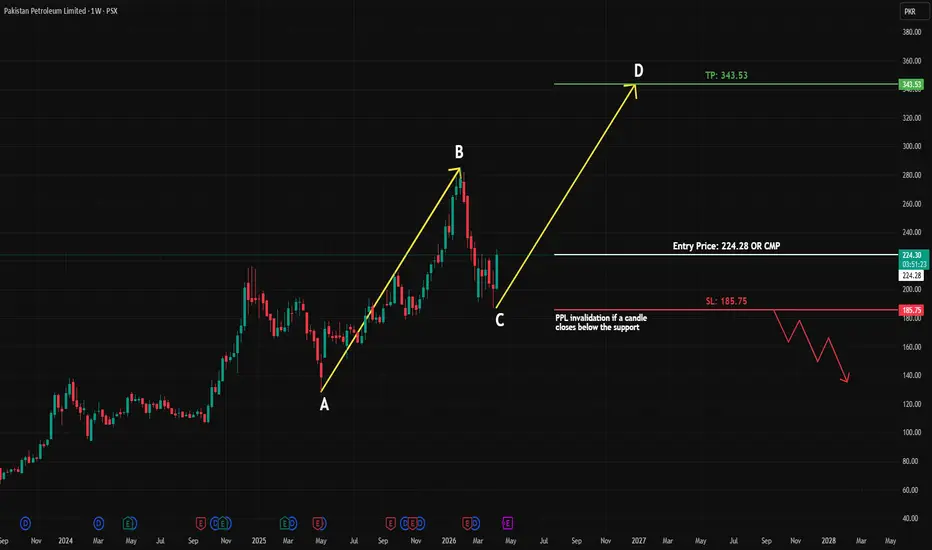
PPL | Weekly Outlook – Potential AB=CD Formation#PPL is currently undergoing a healthy corrective phase, bringing price into a key demand zone, which may offer favorable long-term positioning.
From a structural perspective, the weekly timeframe suggests the development of a potential AB=CD harmonic pattern, indicating a possible continuation to the upside upon completion.
Key Highlights:
• Price approaching high-probability demand zone
• Correction appears controlled and technically healthy
• No strong bearish invalidation observed
• Harmonic structure supports bullish continuation
Strategy:
A long position at CMP can be considered, subject to confirmation and proper risk management.
Note:
This analysis is based on the weekly timeframe and is intended for swing/position traders with a longer investment horizon.
💬 Market Insight Welcome:
Open to discussion and alternative views based on structure and price behavior.
#PPL #TechnicalAnalysis #SwingTrading #LongTerm #HarmonicPatterns #ABCD #PriceAction #EquityMarket #TradingView
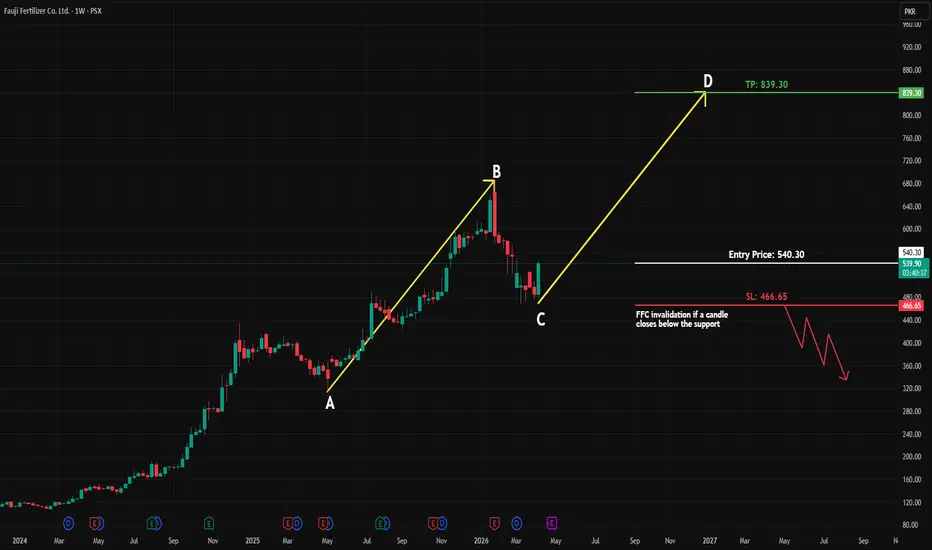
FFC | Weekly Outlook – Potential AB=CD Formation#FFC is currently undergoing a healthy corrective phase, bringing price into a key demand zone, which may offer favorable long-term positioning.
From a structural perspective, the weekly timeframe suggests the development of a potential AB=CD harmonic pattern, indicating a possible continuation to the upside upon completion.
Key Highlights:
• Price approaching high-probability demand zone
• Correction appears controlled and technically healthy
• No strong bearish invalidation observed
• Harmonic structure supports bullish continuation
Strategy:
A long position at CMP can be considered, subject to confirmation and proper risk management.
Note:
This analysis is based on the weekly timeframe and is intended for swing/position traders with a longer investment horizon.
💬 Market Insight Welcome:
Open to discussion and alternative views based on structure and price behavior.
#FFC #TechnicalAnalysis #SwingTrading #LongTerm #HarmonicPatterns #ABCD #PriceAction #EquityMarket #TradingView
AGIL | Weekly Outlook – Potential AB=CD Formation#AGIL is currently undergoing a healthy corrective phase, bringing price into a key demand zone, which may offer favorable long-term positioning.
From a structural perspective, the weekly timeframe suggests the development of a potential AB=CD harmonic pattern, indicating a possible continuation to the upside upon completion.
Key Highlights:
• Price approaching high-probability demand zone
• Correction appears controlled and technically healthy
• No strong bearish invalidation observed
• Harmonic structure supports bullish continuation
Strategy:
A long position at CMP can be considered, subject to confirmation and proper risk management.
Note:
This analysis is based on the weekly timeframe and is intended for swing/position traders with a longer investment horizon.
💬 Market Insight Welcome :
Open to discussion and alternative views based on structure and price behavior.
#AGIL #TechnicalAnalysis #SwingTrading #LongTerm #HarmonicPatterns #ABCD #PriceAction #EquityMarket #TradingView
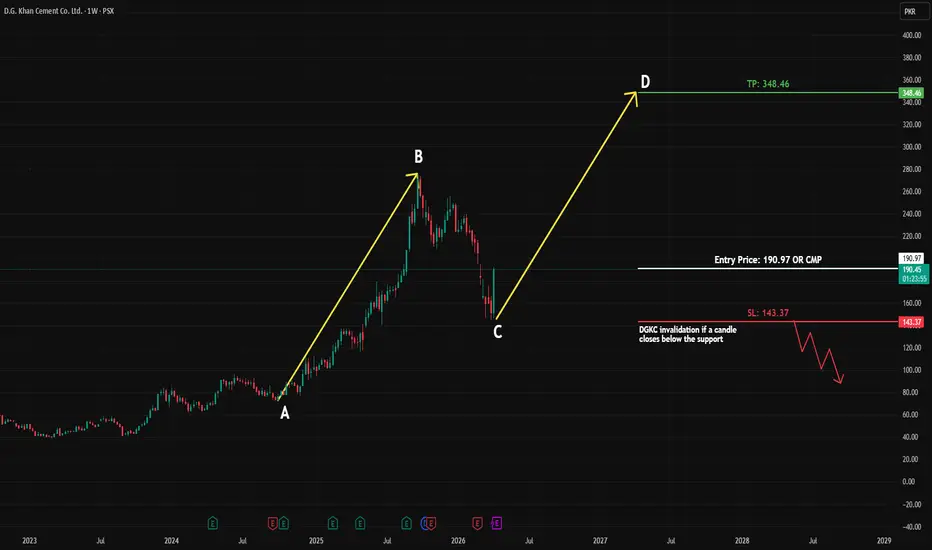
DGKC | Weekly Outlook – Potential AB=CD Formation#DGKC is currently undergoing a healthy corrective phase, bringing price into a key demand zone, which may offer favorable long-term positioning.
From a structural perspective, the weekly timeframe suggests the development of a potential AB=CD harmonic pattern, indicating a possible continuation to the upside upon completion.
Key Highlights:
• Price approaching high-probability demand zone
• Correction appears controlled and technically healthy
• No strong bearish invalidation observed
• Harmonic structure supports bullish continuation
Strategy:
A long position at CMP can be considered, subject to confirmation and proper risk management.
Note:
This analysis is based on the weekly timeframe and is intended for swing/position traders with a longer investment horizon.
💬 Market Insight Welcome:
Open to discussion and alternative views based on structure and price behavior.
#DGKC #TechnicalAnalysis #SwingTrading #LongTerm #HarmonicPatterns #ABCD #PriceAction #EquityMarket #TradingView
PAEL | Weekly Outlook – Potential AB=CD Formation#PAEL is currently undergoing a healthy corrective phase, bringing price into a key demand zone, which may offer favorable long-term positioning.
From a structural perspective, the weekly timeframe suggests the development of a potential AB=CD harmonic pattern, indicating a possible continuation to the upside upon completion.
Key Highlights:
• Price approaching high-probability demand zone
• Correction appears controlled and technically healthy
• No strong bearish invalidation observed
• Harmonic structure supports bullish continuation
Strategy:
A long position at CMP can be considered, subject to confirmation and proper risk management.
Note:
This analysis is based on the weekly timeframe and is intended for swing/position traders with a longer investment horizon.
💬 Market Insight Welcome:
Open to discussion and alternative views based on structure and price behavior.
#PAEL #TechnicalAnalysis #SwingTrading #LongTerm #HarmonicPatterns #ABCD #PriceAction #EquityMarket #TradingView
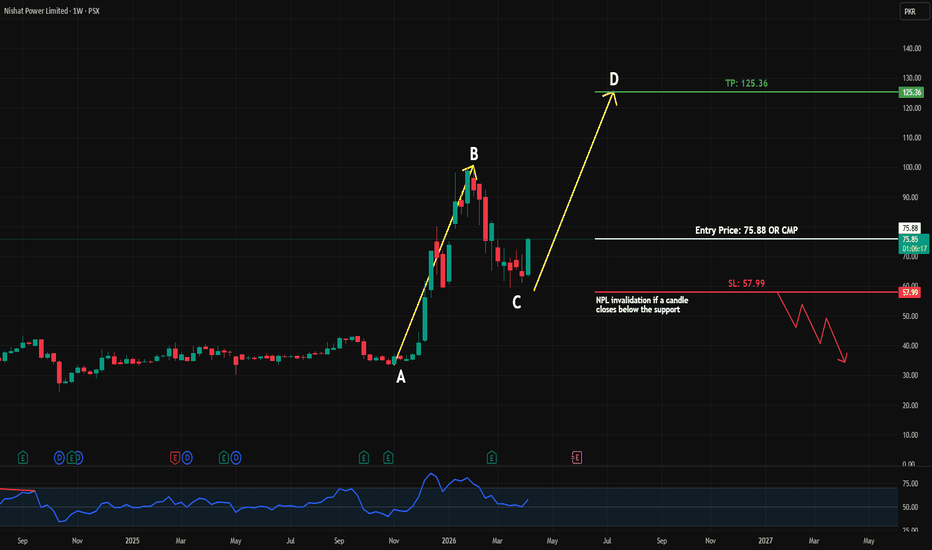
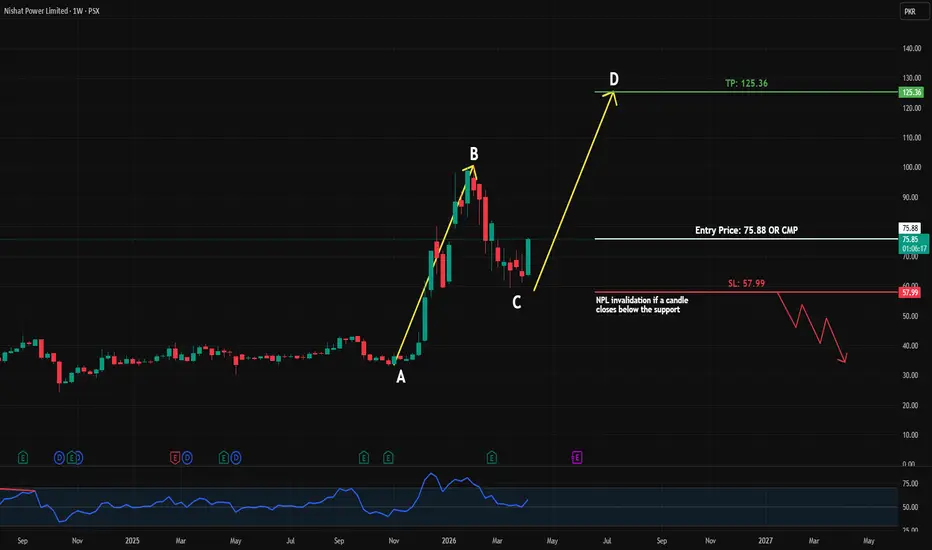
NPL | Weekly Outlook – Potential AB=CD Formation#NPL is currently undergoing a healthy corrective phase, bringing price into a key demand zone, which may offer favorable long-term positioning.
From a structural perspective, the weekly timeframe suggests the development of a potential AB=CD harmonic pattern, indicating a possible continuation to the upside upon completion.
Key Highlights:
• Price approaching high-probability demand zone
• Correction appears controlled and technically healthy
• No strong bearish invalidation observed
• Harmonic structure supports bullish continuation
Strategy:
A long position at CMP can be considered, subject to confirmation and proper risk management.
Note:
This analysis is based on the weekly timeframe and is intended for swing/position traders with a longer investment horizon.
💬 Market Insight Welcome:
Open to discussion and alternative views based on structure and price behavior.
#NPL #TechnicalAnalysis #SwingTrading #LongTerm #HarmonicPatterns #ABCD #PriceAction #EquityMarket #TradingView
BTCUSD : D coming soonWhile price has not been moving much, 'price' here is soon to meet the 'D' as anticipated.
As we can see, the last time this happened, the price went down a lot.
What should we be wary of?
When the price went up the last time, it created TWO necklines.
Price breached neckline 1, and price went down to $60k @ 23.6% fib as anticipated.
If the price goes down to neckline 2, which is further down, we might see the price go to $30k!
We just never know. Just be careful.
Good luck.
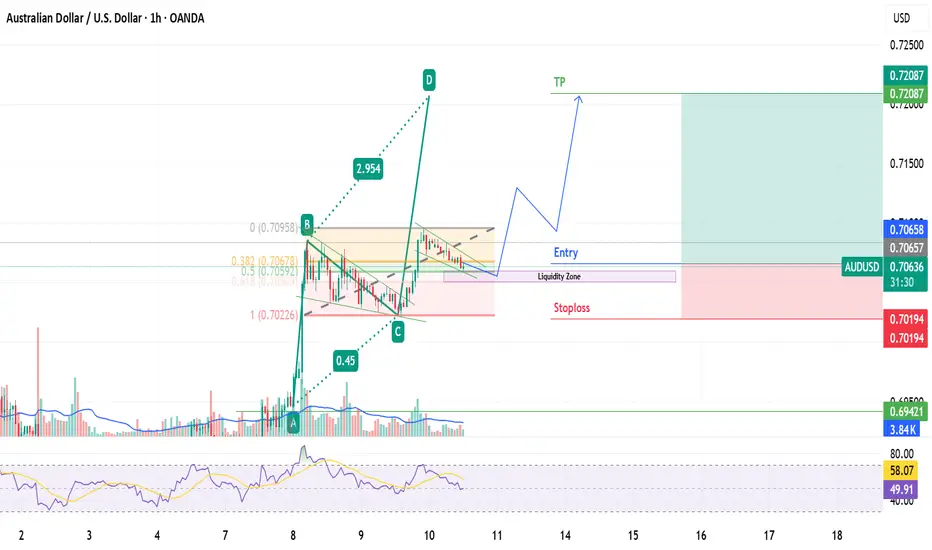
AUD/USD Long Trade IdeaAfter a strong bullish move, AUD/USD is ready for another leg of bullish run.
Bullish Indications:
- Previous Bullish Impulse and accurate fib retracement
- Strong Liquidity Zone, indicating good support level which is also fib 0.5 level
- Volume decreasing with decreasing prices which indicate change of direction
- Previous consolidation on these levels with volumes
Entry: 0.70665
TP: 0.72087
Stop Loss: 0.70195
Risk: 0.4%
RR: 1:3
If it breaks the stop loss it would turn bearish and move towards deeper corrections. Short positions can be planned in that scenario.
Disclaimer: Trade as per own risk management. This is not a financial advice.
KSE 100, 1W (ABCD Projection)Trend Structure:
Weekly trend remains bullish, with higher highs and higher lows intact.
Pattern Formation:
Clear ABCD harmonic pattern in play
A → B: Strong impulsive move
B → C: Healthy correction (~0.5–0.618 retracement)
C → D: Potential continuation leg forming
Current Position:
Price has bounced from Point C, indicating demand zone activation.
Support Zones:
150k – 155k: Strong demand / structural support
Trendline support also aligning near this region
Resistance Levels:
170k – 175k: Immediate resistance
190k – 191k: Major resistance (previous high / supply zone)
Breakout Confirmation:
Sustained move above 190k will confirm continuation toward higher targets.
Target Projection (Point D):
235k – 238k (ABCD completion + channel extension)
Momentum Insight:
Bullish momentum intact as long as higher lows continue forming.
Risk Scenario:
Breakdown below 150k may weaken structure and delay bullish outlook.
Strategy View:
Buy on dips near support zones
Avoid chasing at resistance
Trend favors accumulation, not panic selling
EUR/USD Long Trade IdeaAfter a strong bullish move, the price retraced to Golden Fib Level of 0.618 and is consolidating in this range. The next bullish move of the ABCD Harmonic Pattern is expected to hit TP 1 and TP 2. An aggressive entry would be around 1.63, but it is advised to enter after the liquidity sweep or grab which would confirm the bias, as the move would then become quite bullish.
Entry: 1.16712
Stoploss: 1.16491
TP1: 1.17220
TP2: 1.17715
Risk: 0.4%
RR: 1:4.75
Disclaimer: Plan trade as per your own risk management, this is not financial advice.
NEAR Breaking Structure + AB=CD Pattern | High Probability Long Description:
#NEAR is showing strong bullish momentum on the 1H timeframe, forming a clean AB=CD harmonic pattern while successfully breaking previous Higher Highs (HHs) — a clear sign of trend continuation. The market structure is bullish with no visible bearish divergence or weakness, indicating buyers are in full control. With price holding above key structure, this looks like an ideal opportunity to enter a long position at current market price (CMP). As always, wait for confirmation and manage your risk properly to capitalize on this high-probability setup.
#NEAR #CryptoTrading #TradingView #Bullish #HarmonicPattern #ABCD #PriceAction #Breakout #SmartMoney #RiskManagement