HYPE Just Broke Out _ But This Could Still Be a TrapOver the weekend, Hyperliquid ( BINANCEUS:HYPEUSDT HYPE) drew major attention across the crypto community and rallied by roughly +20%. The move was fueled by the USDC revenue shift narrative and the market’s focus on HYPE’s programmatic buyback dynamics tied to protocol revenues, alongside fresh media hype. In parallel, SpaceX-related perpetual contracts on a platform built on Hyperliquid infrastructure brought attention from outside the crypto bubble as well.
Now, let’s take a technical look at the HYPE token on the 4-hour chart.
The HYPE token recently hit new all-time highs thanks to recent news, and it seems to have broken through the resistance zone($62.00-$59.00). However, the volume on the breakout wasn’t particularly high, so there’s some concern that this could be a fake breakout.
The HYPE token is also near the Cumulative Short Liquidation Leverage($66.20-$64.80), a Potential Reversal Zone(PRZ) , and the psychological round number of $70. Over the past 10 days, it has been moving within an ascending channel.
From Elliott Wave Theory, it seems the HYPE token is finishing its main wave 5, so we might expect a corrective phase afterward.
I expect the HYPR token to start declining after entering the Cumulative Short Liquidation Leverage($66.20-$64.80) and from the top of the ascending channel and PRZ.
First Target: $60.10
Second Target: $57.93
Third Target: $55.20
Stop Loss(SL): $70.10(Worst)
What do you think about the HYPE token? Can it break past $70, or should we expect a corrective phase?
💡 Please respect each other's opinions and express agreement or disagreement politely.
📌Hyperliquid Analyze (HYPEUSDT), 4-hour time frame.
🛑 Always set a Stop Loss(SL) for every position you open.
✅ This is just my idea; I’d love to see your thoughts too!
🔥If you find it helpful, please BOOST this post and share it with your friends.
Ascending Triangle
EURUSD - Consolidation above key resistanceFX:EURUSD opened the week with a bullish gap amid hopes for a U.S.-Iran peace deal, erasing the previous week’s decline to a low of 1.1575
The euro is caught in a stagflation trap: weak PMIs and the risk of recession are causing the market to doubt the ECB’s ability to tighten policy, despite inflation above 3%. Technically, the focus is on the 1.16357–1.1660 range. Continued optimism regarding the situation in the Middle East could support further gains (the market may strengthen from 1.1635 toward 1.168–1.1722)
Resistance levels: 1.1635, 1.168, 1.1722
Support levels: 1.1627, 1.1583
Technically, there are attempts to break the local structure; the reason is a gradual shift in the geopolitical backdrop and a weakening dollar, which presents opportunities for the euro.
If the bulls keep the price above 1.1635, this could become a technical driver for growth
Best Regards, R. Linda!
COIN Ascending Triangle Setup—Watching for Breakout ContinuationWe already caught a strong earnings move in our previous Coinbase analysis, where NASDAQ:COIN surged nearly 44%. Now, the chart is presenting another interesting setup as price forms a clean ascending triangle pattern on the higher timeframe.
COIN has now reached the apex of the triangle, which means the market is getting closer to a potential breakout decision. As long as buyers continue defending the structure, this setup favors a possible long trade continuation toward the next resistance zones.
The plan is to look for a long entry near the current support area and ride the move toward the breakout zone. However, proper risk management is important because a breakdown below support would invalidate the bullish setup.
Trading Levels
Entry Zone: Around $190
Take Profit 1: $205
Take Profit 2: $216
Stop Loss: $179
Risk Management: If COIN breaks below $179, the bullish structure becomes invalid, and the trade should be avoided or closed.
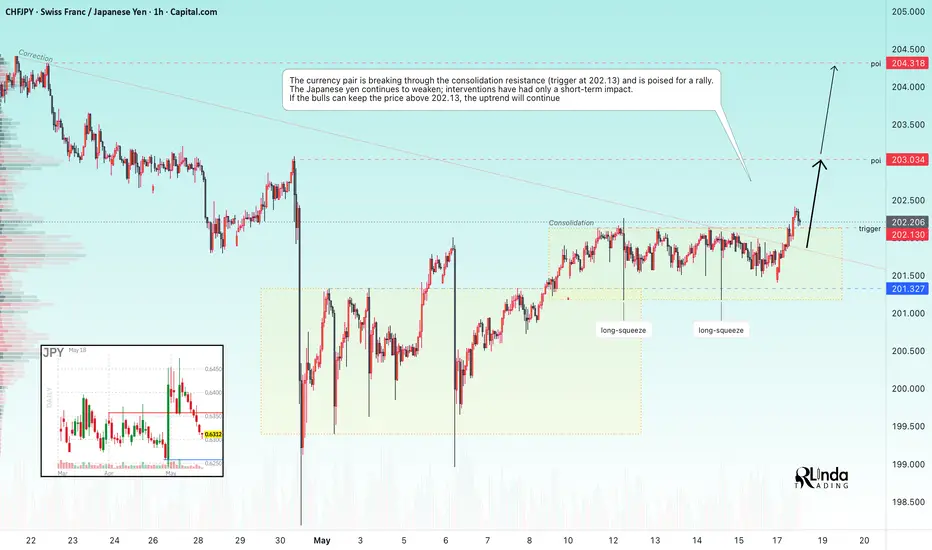
CHFJPY - From consolidation to distribution. Bullish trend FX:CHFJPY remains in a long-term uptrend. The market is currently in a correction, but there are signs that it is coming to an end. The uptrend may continue.
The Swiss franc is consistently outperforming the dollar (USD/CHF cannot hold above current levels) and, to an even greater extent, the yen in the CHFJPY pair, driven by geopolitical factors. The SNB’s intervention parameters remain unchanged regardless of the level, while interventions by the Bank of Japan lead only to short-term reactions, and Japan’s national currency continues to depreciate.
The pair is trading within a steady daily uptrend. After rebounding from the 198.65 support level (May 11), the price recovered above 201.50 and is forming a consolidation with a trigger at 202.13; a breakout above this level will strengthen buying pressure
Resistance levels: 203.034
Support levels: 202.13
An attempt to break through the consolidation resistance at 202.13 is forming. The price is correcting for a possible retest of key support before rising. The global trend is expected to continue after a break of 202.13
Best regards, R. Linda!
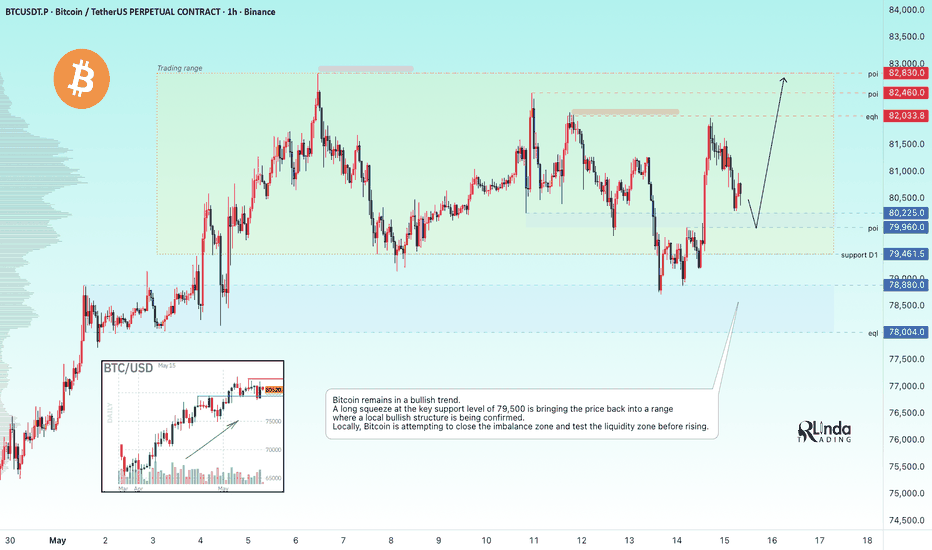
BITCOIN - Bullish trend. The hunt for liquidity ahead of a rallyBINANCE:BTCUSDT.P is trading within the range of 79,500–82,800. The trend is bullish; the price continues to maintain this momentum and test the 200-day moving average, a breakout of which could strengthen the trend—though this will require patience...
May began with a strong institutional inflow: in the first 10 days of May, spot ETFs attracted over $1.25 billion, marking the sixth consecutive week of net capital inflows. The movement was spurred by progress on the CLARITY Act—the main legislative initiative to regulate digital assets in the U.S.
Bitcoin maintains a bullish trend. A long squeeze of the key support zone at 79,500 is bringing the price back into a range where a local bullish structure is being confirmed. Locally, Bitcoin is attempting to close the imbalance zone and test the liquidity zone before rising.
Resistance levels: 82,000, 82,460, 82,830
Support levels: 80,220, 79,960, 79,500
A retest of support, a liquidity capture, and the bulls holding the price above 80K could become the next technical driver for growth
Best Regards, R. Linda!
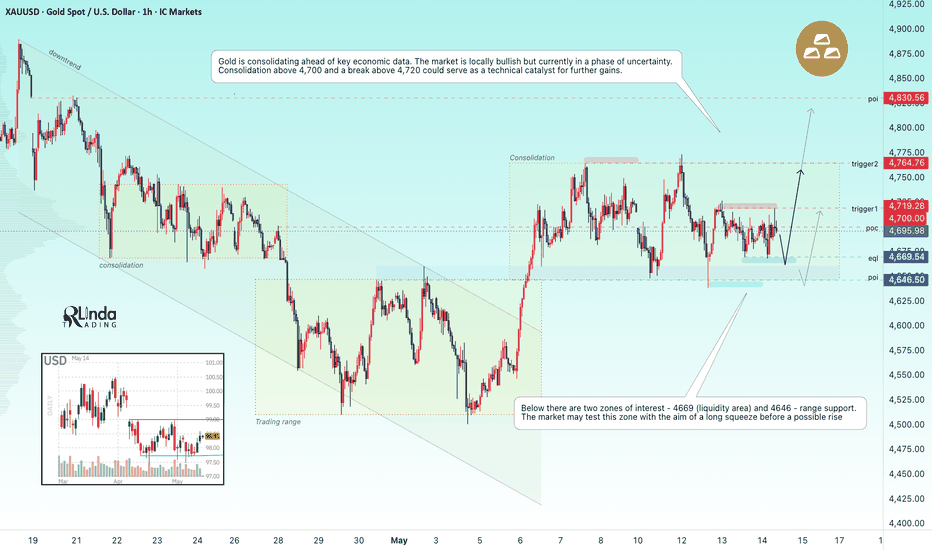
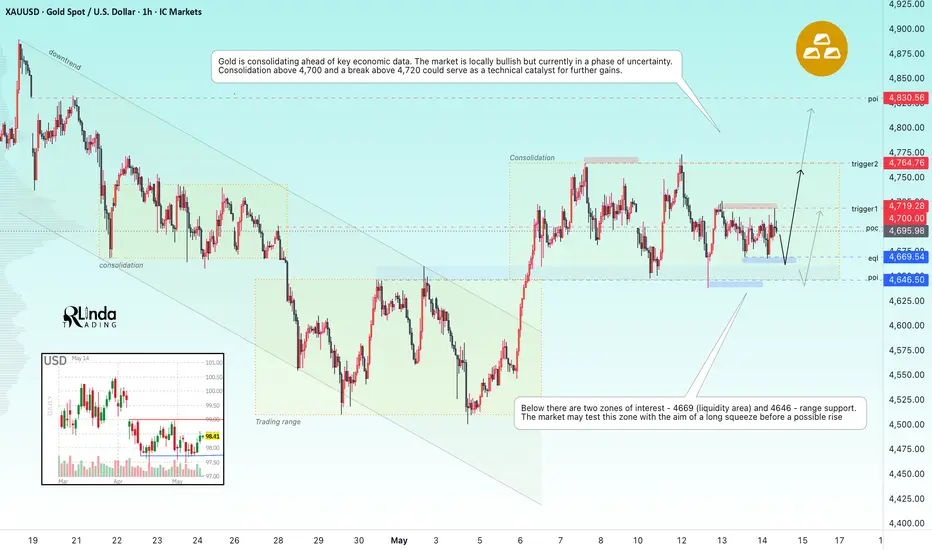
GOLD - Consolidation before a strong moveICMARKETS:XAUUSD is in a bullish consolidation phase, trading within the 4,650–4,750 range. The market is awaiting the outcome of the meeting between Trump and Xi Jinping, as well as the release of the latest economic data.
The lack of progress in U.S.-Iran negotiations and rising inflation expectations have increased bets on a Fed rate hike this year. Inflation confirms the impact of the trade war: CPI (3.8% y/y). The data reinforces hawkish expectations. However, Kevin Warsh’s confirmation as Fed chair offers a glimmer of hope. The market is anticipating a rate cut...
Gold is stuck at the lower end of its weekly range, awaiting a catalyst. Key variables include the outcome of the Trump-Xi summit, U.S. retail sales data, and the geopolitical backdrop regarding the conflict in the Middle East.
Technically, gold is consolidating after breaking through global downward resistance. Essentially, the current consolidation is a step toward a strong move...
Resistance levels: 4700, 4720, 4764
Support levels: 4669, 4646
Before rising, the market may test the support cluster located at the bottom of the range—4669, 4646 (a long squeeze would provide an opportunity for growth). However, if the bulls keep the price above 4700, this could become another technical driver for growth
Best Regards, R. Linda!
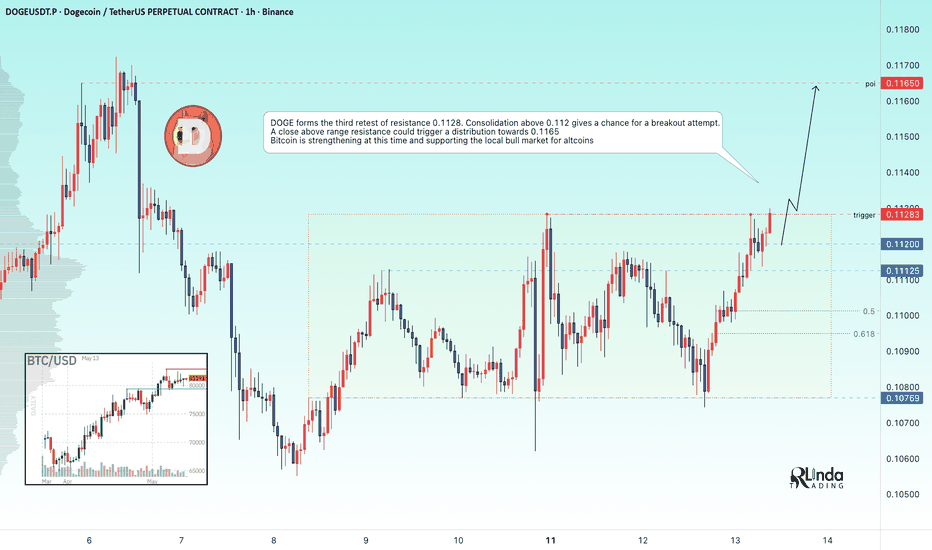
DOGEUSDT - A retest of resistance during a bullish trend BINANCE:DOGEUSDT tested the 0.10600 support level as part of a medium-term correction and resumed its upward trend. The market is testing an intermediate trigger ahead of a potential rally.
Meanwhile, Bitcoin is gaining strength and supporting the local altcoin bull market. The flagship cryptocurrency has maintained an uptrend since late March.
DOGE is forming its third retest of the 0.1128 resistance level. Consolidation above 0.112 offers a chance for a breakout attempt. A close above the range’s resistance could trigger a move toward 0.1165
Resistance levels: 0.1128, 0.1165
Support levels: 0.112, 0.11125
A breakout above resistance could trigger continued growth. Locally, the market is influenced by bullish sentiment. Globally, we previously discussed the medium-term structure of the altcoin; after months of consolidation, DOGE may transition into a bullish trend
Best regards, R. Linda!
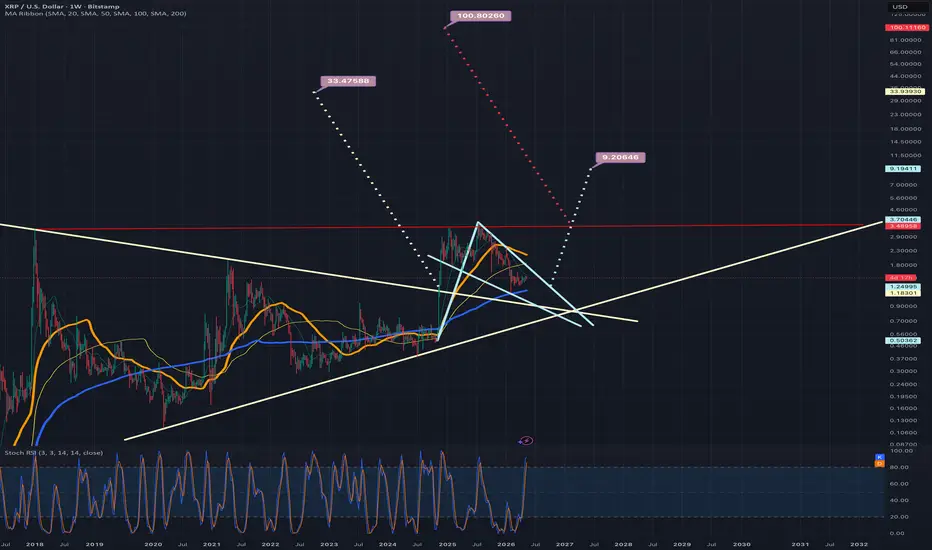
An updated look at the weekly logchart for xrpusdWe can see price action is currently consolidating inside a bull pennant that I have colored light blue here and as long as the blue 200 weekly MA maintains solid support price should break upward from the pennant by the time it reaches where I have placed the dotted measured move line. If that is the point at which it breaks out the target is around $9.19 or so but on my linear weekly chart (not shown here) price is currently a weekly candle or 2 away from breaking above the top trendline of a wedge on that chart that has a breakout target around 3.09 or so. So if that linear wedge plays out odds are good we would also breakout up from this log chart pennant considerably sooner than where I have arbitrarily placed the dotted line, in which case the price target for this log pennants breakout would be even higher than 9.18 potentially even above 10 dollars at that point. We can also see that we have two other even bigger chart patterns here on this weekly log chart as well. The tan colored symmetrical triangle, and the ascending triangle with the red line as its top trendline. The tan triangle’s breakout target around $33 and the ascending triangles target all the way up at $100. Being a log chart, some of these bigger patterns will take much longer to hit their targets than the linear chart patterns usually take to reach theirs, however I believe we are very likely to hit the smaller light blue pennant’s breakout target by sometime next year at the latest and possibly even this year, I have included the linear weekly wedge chart for xrpusd in a link below *not financial advice*
GBPUSD - Long squeeze can lead to a reboundFX:GBPUSD is forming a bearish rally following a short squeeze and is testing support at 1.35000
The Dollar Index looks weak on the D1 chart, with bears applying pressure; however, intraday volatility depends on fundamental and geopolitical factors. The market has entered a correction phase since the session opened. The British pound is currently testing the support level of the trading range. A long squeeze is forming within the local bullish trend. The pound may bounce off the support formed by the range
Resistance levels: 1.358, 1.364
Support levels: 1.3512
A long squeeze, the formation of a reversal pattern, and price consolidation above key support could support a potential rise to 1.358
Best Regards, R. Linda!
ETH 12H: CVD Divergence at Channel MidETH/USDT Perp — 12H and 1D | Bybit | May 12, 2026
Price is pressing into the 2414 resistance zone for the second time. The candles look constructive. The CVD tells a different story.
Structure context:
ETH has been inside a clean rising channel since the February lows near 1480. Price has respected both the channel boundaries and the key horizontal levels throughout the structure. The VRVP confirms two dominant volume nodes: the 2080 zone (prior consolidation base) and the current 2325 area. Price is now pulling back from the 2414 resistance zone and sitting at the 2325 orange level, which is the first line of structural defense.
CAP Framework gate read:
Gate 1 — Regime: Bullish structure on the 12H and daily. Higher highs, higher lows from February through early May. No macro breakdown in play yet. Regime is intact but pressing into a key ceiling.
Gate 2 — BOS: No confirmed Change of Character on the 12H. The pullback from 2414 is within normal channel behavior. A daily close below 2325 changes the read. Until then, no structural break confirmed.
Gate 3 — OTE: Current price at 2280-2300 is within the Optimal Trade Entry zone from the most recent leg up. The 2080 yellow level is the deeper OTE and institutional demand base if 2325 fails on a close.
Gate 4 — CVD: Bearish divergence confirmed on the 1D. The blue CVD line has been declining for approximately two weeks while price printed a new high in early May. This is quiet selling into strength, not panic, not a leverage flush. Funding rate has flipped slightly negative. Shorts are now paying longs. This compresses immediate downside velocity but does not resolve the divergence.
Gate 5 — Signal grade: No long entry at current grade. CVD divergence at double resistance is a reduce-and-wait signal, not an add signal. No short until 2325 breaks and holds on a close.
IF/THEN scenarios:
Bull case: Price holds 2280-2300 on the 12H close. CVD stabilizes and turns. Reclaims 2325 as support. Targets 2414 resistance, then 2480 upper channel. Invalidated on a clean close below 2280.
Bear case: Daily close below 2325 with CVD continuing lower. Volume profile offers minimal support between 2325 and 2080. Next honest conversation is the yellow level at 2080. Full structural invalidation below 1925.
The close is the signal. Not the wick.
GOLD - Long squeeze at 4650. Gold within a flat patternICMARKETS:XAUUSD has been correcting toward the liquidity zone of 4660–4646 since the start of the session. The price is forming a trading range for a possible consolidation. At the same time, there is a long squeeze relative to strong support. But there’s always a “but”...
Breakthrough in negotiations: Developments surrounding the Middle East talks are moving slowly but steadily. The market is reacting, and the dollar currently looks weak relative to the 98.0–97.5 support zone. A further decline in the index will support the metal.
The geopolitical situation remains tense; any misstep could trigger a sharp market reaction. Oil remains relatively expensive, fueling inflation fears and putting pressure on gold.
Gold is stuck between a geopolitical stalemate (supported by oil and the dollar) and anticipation of key CPI inflation data (Tuesday). Gold may remain within the 460–4750 range
Resistance levels: 4679, 4723, 4764
Support levels: 4660, 4646
A long squeeze at support could shift the balance of power toward buyers, especially given the previously broken bearish (local) structure. If the bulls hold the price above 4660–4650, this could become a technical driver for growth toward 4723–4764–4830
Best regards, R. Linda!
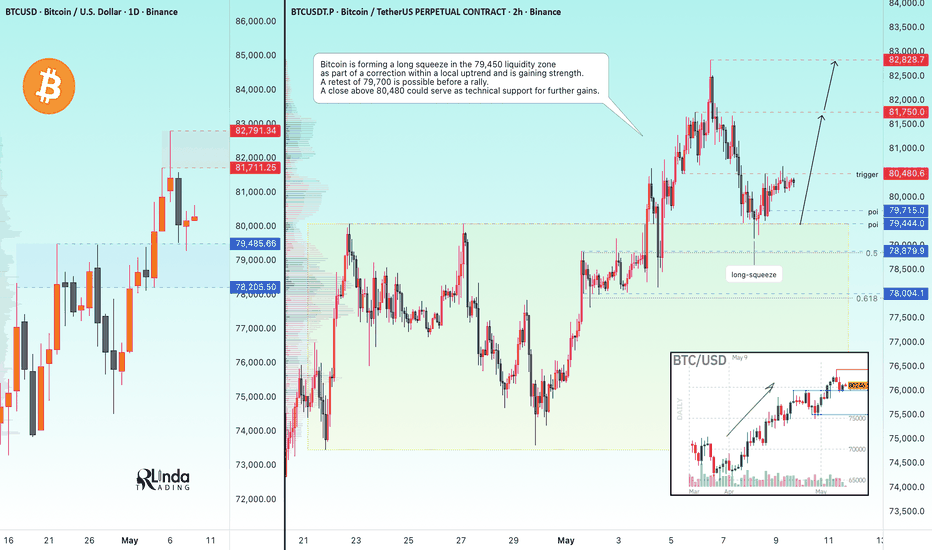
BITCOIN - The bull market is consolidating above 79,500 BINANCE:BTCUSDT.P is maintaining the upward trend that began in late March and is showing signs of a bull market. A trading range has opened up between $79,000 and $95,000...
The geopolitical backdrop is unstable, but Bitcoin has proven to be a fairly confident player in the current market; however, when compared to the movement of U.S. stock indices, which are the driver for the flagship asset, it is lagging behind. Nevertheless, after a prolonged consolidation, the market has entered a growth phase. The local high has been updated to 82,800, but at the same time, a false breakout of the local resistance at 81,700 has formed. The result is a correction and a retest of the liquidity zone and the strong support area at 79,485. The long squeeze, in turn, shifts the balance of power toward buyers and allows the market to consolidate. The structure remains intact, and after local consolidation or a retest of the zone of interest, growth may continue
Support levels: 79,700, 79,450, 78,800
Resistance levels: 80,480, 81,750, 82,830
The market is consolidating near the key resistance level of 80,480. A breakout and close above this zone could trigger a continuation of the uptrend toward 81,750–82,830. However, I do not rule out an attempt to retest the 79,700 zone of interest before a bullish run.
Best regards, R. Linda!
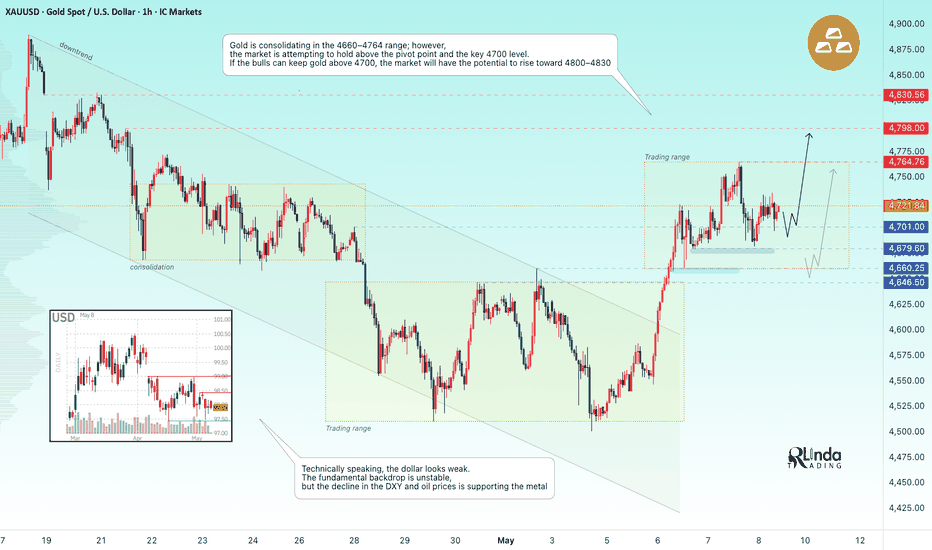
GOLD - Consolidation above 4,700...Gold is testing the downward resistance of the daily market structure. A de-escalation in the Middle East and consolidation above 4,700 could provide an opportunity for a shift in market sentiment.
Gold is holding above $2,700 amid geopolitical uncertainty and anticipation of key NFP data on the U.S. labor market. The main drivers of growth are weakening demand for the dollar and hopes for a Fed rate cut in the event of weak employment statistics. The fate of the precious metal depends on progress in U.S.-Iran negotiations and the NFP data
Technically, the dollar looks weak. The fundamental backdrop is unstable, but the weakening of the DXY and oil prices is supporting gold
Gold is consolidating within the 4,660–4,764 range; however, the market is attempting to hold above the pivot point and the key 4,700 level.
Resistance levels: 4764, 4798, 4803
Support levels: 4700, 4660, 4646
Technically, the market is in a consolidation phase within the range. Focus is on 4700 and the 4660–4646 cluster. Given the news, if the fundamental backdrop remains unchanged, the market may form a long squeeze before rising. However, if the bulls keep gold above 4700, the market will have the potential to rise to 4800–4830.
Best regards, R. Linda!
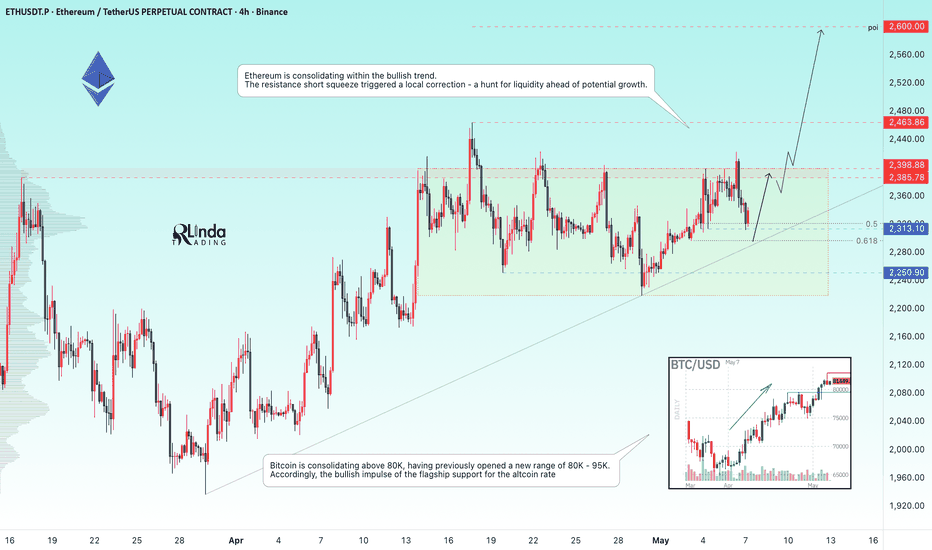
ETHUSDT - A pullback before breaking through 2400...BINANCE:ETHUSDT.P is forming a correction following a short squeeze. The altcoin is testing a key support level within its uptrend and may continue to rise. The uptrend remains intact
Bitcoin is consolidating above the 80,000 mark, having previously opened a new range of 80,000–95,000. The consolidation is forming above resistance, i.e., in the buying zone.
Accordingly, the flagship coin’s bullish momentum will support altcoin prices.
Ethereum is forming a liquidity hunt (correction) within the trading range. The correction does not break the bullish trend but gathers liquidity for a possible breakout of the consolidation resistance.
Resistance levels: 2,385, 2,398, 2,463
Support levels: trendline, 2313, 2250
If the bulls hold the price above 2315, this will confirm the formation of a local bottom and support the bullish trend. A breakout above 2400 could trigger a rally toward 2600
Best regards, R. Linda!
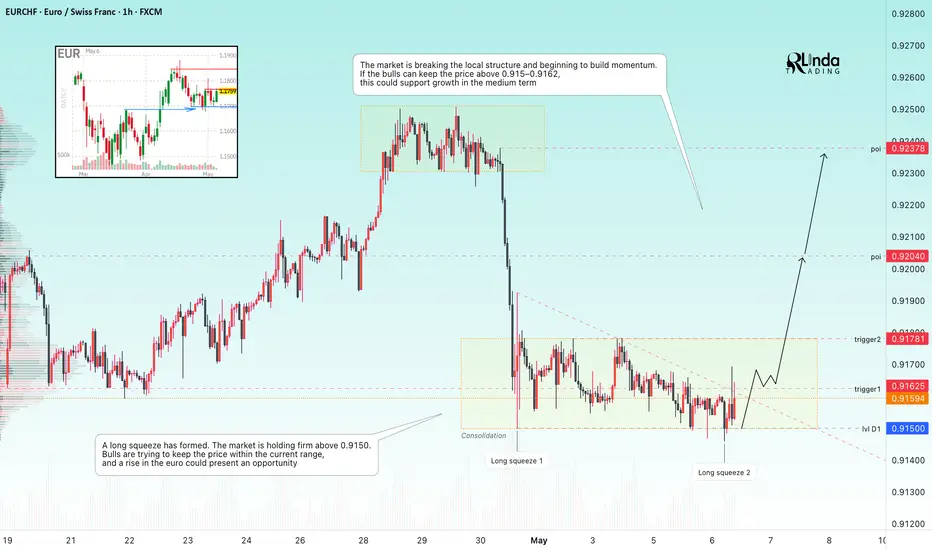
EURCHF - Consolidation ahead of the rally FX:EURCHF is forming a long squeeze amid a local uptrend. Bulls are trying to hold key support...
A long squeeze has formed. The market is not letting the price fall below 0.9150. Bulls are trying to keep the price within the current range, and a rise in the euro could provide an opportunity for a bullish run.
The market is breaking the local structure and beginning to build momentum.
Resistance levels: 0.9162, 0.9178, 0.92
Support levels: 0.915
A long squeeze following a sharp drop could be a liquidity-hunting pattern ahead of a reversal. If the bulls hold the price above 0.915–0.9162, this could support a rise to 0.92–0.924 in the medium term
Best regards, R. Linda!
Price Action Education Series: Ascending Triangle PatternThe ascending triangle is one of the clearest bullish continuation patterns in price action — but only when you understand what it is actually showing.
At first glance, it looks simple:
• Price keeps hitting the same resistance level
• Buyers keep stepping in at higher prices
• The range tightens
• Then price breaks out
But the real lesson is this: an ascending triangle is a picture of growing pressure beneath a ceiling. 🧠
Sellers are defending one horizontal area again and again, but buyers are becoming more aggressive. Instead of pulling all the way back each time, price forms higher lows. That tells you demand is stepping up sooner on every dip.
In other words:
➡️ sellers are holding the line
➡️ buyers are willing to pay more and more
➡️ pressure builds until resistance either breaks… or the setup fails
That is why this pattern matters.
✅ What defines a true ascending triangle?
1. A clear uptrend or bullish context leading into the pattern
2. A relatively flat resistance line across the top
3. Rising lows underneath price
4. Tightening price action as the pattern develops
5. Ideally, lighter volume during the formation and stronger volume on the breakout
The pattern should look like price is getting squeezed into the resistance level — not just randomly drifting higher.
🚨 What traders often get wrong:
A lot of people label any rising chart as an ascending triangle. That is incorrect.
If the top is not relatively flat, it is not a proper ascending triangle.
If there are no clear higher lows pressing into resistance, it is not a proper ascending triangle.
If there is no compression, there is no pressure.
Pattern accuracy matters.
📍What is the psychology behind it?
Every time price pulls back, buyers step in earlier.
That means dip buyers are gaining confidence.
At the same time, sellers sitting at resistance are being forced to absorb repeated tests.
Eventually one of two things happens:
1. The resistance finally gives way and trapped shorts / breakout buyers help push price higher
2. Buyers fail to break the ceiling, momentum fades, and the setup loses validity
That is why confirmation matters.
✅ Strong confirmation signs:
• Multiple touches of resistance
• Clean sequence of higher lows
• Tightening structure near the apex
• Breakout candle closes firmly above resistance
• Volume expands on the break
• Retest holds the breakout zone as support
⚠️ Warning signs of weakness:
• Break above resistance that immediately fails
• Breakout with no momentum follow-through
• Volume stays weak on the break
• Price falls back inside the triangle
• Rising support gets lost
A failed breakout can quickly turn into a trap.
🎯 How many traders project targets:
A common measured move is the height of the triangle added to the breakout point.
Example:
If the triangle is $2 tall from support to resistance, traders may project roughly $2 above the breakout area as a potential target.
That does NOT guarantee price will reach it — but it gives structure for planning.
🛠 Practical trading mindset:
Don’t chase every candle near resistance.
Let the pattern prove itself.
Ask:
• Is resistance actually flat?
• Are buyers clearly stepping in higher?
• Is price compressing?
• Did breakout volume expand?
• Did the breakout hold?
The best setups are not just about shape.
They are about pressure, positioning, and confirmation.
The ascending triangle is bullish because it shows buyers gaining ground before the breakout ever happens. Learn to read that pressure correctly, and you stop seeing random candles… and start seeing the story behind the move. 🔥
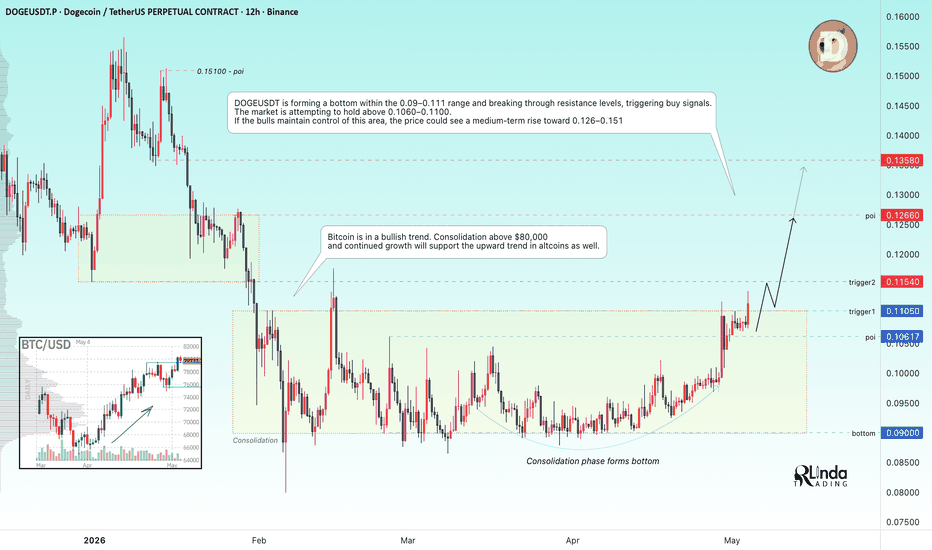
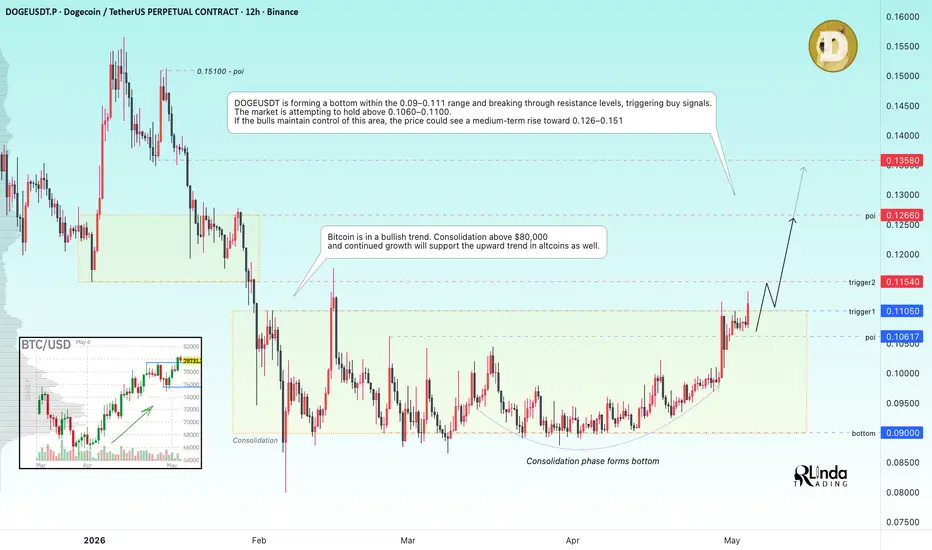
DOGEUSDT - The consolidation is forming a global bottom BINANCE:DOGEUSDT is forming a bottom at 0.09–0.10. The market is entering an intermediate rally phase and preparing for further growth...
Bitcoin is in a bullish trend. Consolidation above 80K and continued growth will support the growth phase in altcoins as well.
DOGEUSDT is forming a bottom within the 0.09–0.11 range and breaking through resistance, activating triggers. The market is attempting to hold above 0.1060–0.1100. If the bulls maintain control of this area, the price could form a medium-term uptrend toward 0.126–0.151
Support levels: 0.1105–0.1060
Resistance levels: 0.1154, 0.1266, 0.1358
The market is showing bullish signs, with the flagship forming a bullish trend over the past month and a half. Doge is emerging from a consolidation phase, and maintaining the price above the key support zone could become the next technical driver for growth. Doge may continue to rise from 0.1100–0.10600; medium-term growth potential is emerging.
Best regards, R. Linda!
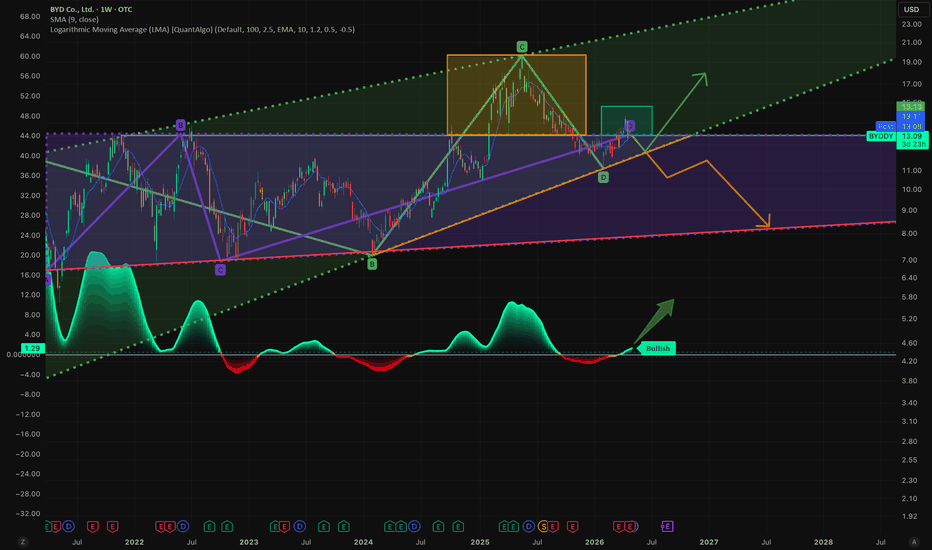
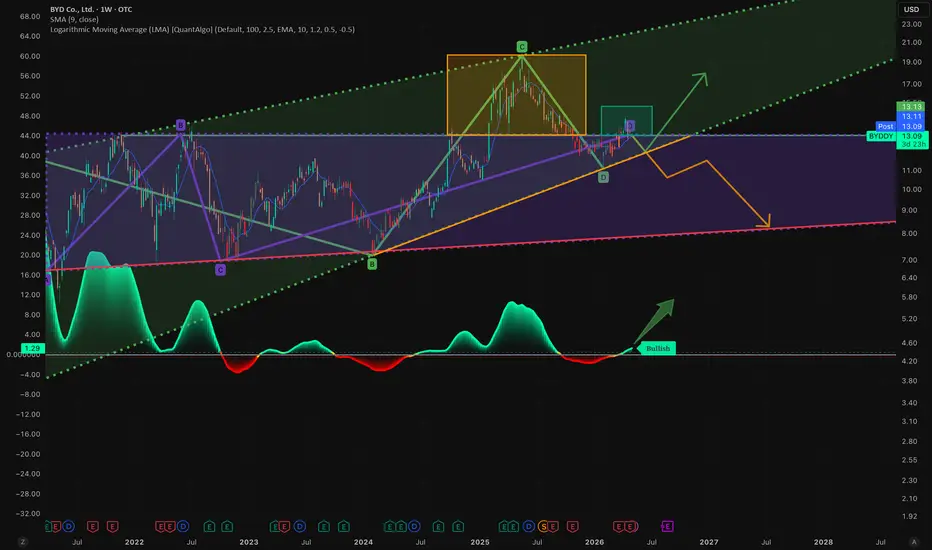
BYD ascending triangle breakout formationBYDDY price is testing the ceiling of a multi-year ascending triangle formation with bullish logarithmic moving average (LOGMA) movement to the upside. If price can test this breakout zone (turquoise rectangle), price volatility may likely continue to the upper channel (in green), if it cannot then price will likely consolidate back into the sideways ascending triangle formation (in purple).
GBPUSD - The bulls have maintained control of the support levelFX:GBPUSD is returning to a range following a local price manipulation. A breakdown of the local structure is forming amid a market correction and a weakening dollar
Locally, the dollar is entering a correction, while the British pound is strengthening after a failed attempt to break through support. The market has held the decline
The manipulation ends with a long squeeze; bulls have kept the market in the 1.345–1.348 zone. Consolidation above the range’s support level will provide an opportunity for growth
Resistance levels: 1.3505, 1.3563, 1.3589
Support levels: 1.3483, 1.3474
The formation of a reversal pattern and price consolidation above 1.348–1.350 will support the upward momentum and a move toward the range’s resistance
Best Regards, R. Linda!
EURJPY - The end of the correction will lead to an uptrend FX:EURJPY remains in a bullish trend. Signs of the correction coming to an end are emerging, which generally gives the market a chance to continue its upward movement.
The currency pair has been in a bullish trend since last March. Technically, the bullish structure remains intact. The weak Japanese yen is supporting the euro’s upward movement.
Technically, the price is breaking through the resistance of the local correction and local consolidation. If the bulls keep the price above 186.8–186.87, we can expect growth to continue in the medium term.
Resistance levels: 187.92, 187.70
Support levels: 186.87, 186.43
A retest of 186.87 and price consolidation above that level will confirm the price’s readiness for growth. Zones of interest: 187.7–187.95
Best regards, R. Linda!
NZDJPY - The uptrend may continue FX:NZDJPY is consolidating above a key daily support zone. The weak Japanese yen could support the currency pair’s rise
The Japanese yen is consolidating within a downtrend. The index is contracting toward support; a break below this level would lead to a further decline in the JPY, which could have a positive impact on the NZD. For this reason, I expect short-term growth.
Consolidation is forming above 93.77–93.89 (above the key daily support). If the bulls hold their ground above this zone, the currency pair may enter a distribution phase
Resistance levels: 94.100, 94.32, 94.66
Support levels: 93.89, 93.77
The trend is bullish; consolidation above key support could trigger a continuation of the uptrend
Best regards, R. Linda!