EURUSD BUY 1.1394On the daily chart, EUR/USD continues to pull back, with short-sellers holding the upper hand in the short term. Attention should be focused on the support level near 1.1394; this level serves as the entry point for a potential bullish Bat pattern and also lies within a previous demand zone.
Bat
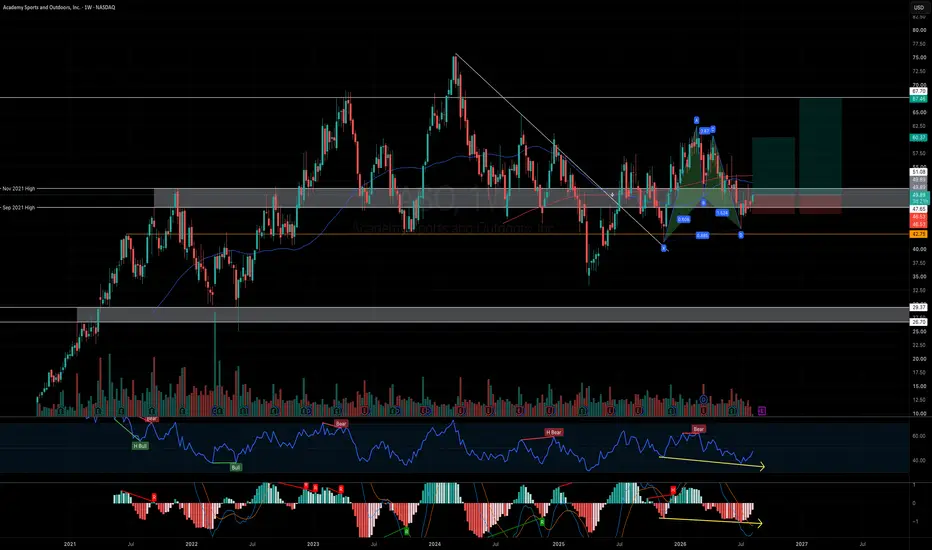
SYK: Bullish Bat Pattern With Strong Upside PotentialSYK is showing a bullish Bat pattern on the chart, with price now approaching the Potential Reversal Zone around the $262–$275 area.
This is an interesting setup because the Bat is completing near an important support area. If buyers step in and the pattern holds, SYK could have significant room to the upside.
Trade Setup
Entry Zone: $262–$275
Stop Loss: $249
Take Profit Targets:
TP1: $329
TP2: $355
TP3: $377
TP4: $450+
What I’m Watching
The $262–$275 area is the key reversal zone. This is
BCH/USD: 2 Bullish Structures Pointing Toward the Same ReversalBitcoin Cash is approaching an interesting area on the weekly chart where 2 different technical structures appear to be lining up around the same price level.
The first is a potential Elliott Wave triangle, with the market potentially completing wave (E) near the $112-115 area.
At the same time, there is a potential bullish harmonic pattern completing in essentially the same zone. When two different methods point toward the same area, I think it is worth paying attention.
The $112 -115 Area I
AUDNZD: EW Decision Point —Triangle Breakout or Bearish reversalGood day traders,
I trust your week has been a profitable one.
Please allow me to share my outlook on the current AUDNZD market.
AUDNZD is approaching a key decision zone, with two Elliott Wave scenarios competing for control. I think the next move should provide important confirmation of the medium-term direction.
Primary Case: Rally Into Resistance, Then Bearish Continuation
The primary count (above) suggests the current advance is completing wave (c) of a larger wave (b), with price pot
A HOME RUN TRADE Is Setting Up! | Aussie Swiss Trading AnalysisEvery once in a while, the market gives you a setup where multiple pieces of analysis start pointing in the same direction. The AUDCHF may be offering one of those opportunities.
The higher-timeframe trend is bullish, while the 4-hour and 1-hour charts are showing a bullish flag pattern. But what makes this setup even more interesting is the potential Bullish BAT harmonic pattern developing within that structure.
That creates an interesting question: Could this be a home run trade?
Great trad
BTCUSD - Beartish BatBTCUSD – Bearish Bat / Exhaustion Watch
BTCUSD has completed a bearish harmonic structure near the 0.886 XA retracement, with price reacting around the D-point after a very strong impulsive rally. The move into the PRZ is stretched, and RSI is showing clear momentum exhaustion after reaching elevated levels.
In relation to the volume profile, price has pushed from the lower value area all the way into the upper high-volume region, now trading near the upper edge of acceptance. This suggests th
XAUUSD - Bearish BatGold has completed a bearish bat, Albeit the B point is at a 382 fib level,
with the D-point pressing into a major resistance zone and the VAH area of the volume profile.
Price is currently rejecting from the upper value region, while RSI remains elevated and has shown multiple bearish divergence signals.
bullish momentum seems to be weakening at a key confluence area, making this zone important to watch for bearish rejection and potential rotation back toward value.
FET/USDT Bullish Setup
FET/USDT is showing **two bullish harmonic patterns** at the same time: a **Bullish Bat** (green) and a **Bullish Butterfly** (yellow).
A **Bullish Bat** is a harmonic pattern that looks for a potential price reversal from a lower support area.
A **Bullish Butterfly** is another harmonic pattern that can signal a possible bullish reversal after a strong decline.
Here, both patterns point to the same area, making the **$0.0777–$0.0900 zone** important to watch.
**Entry:** Look for a bullish
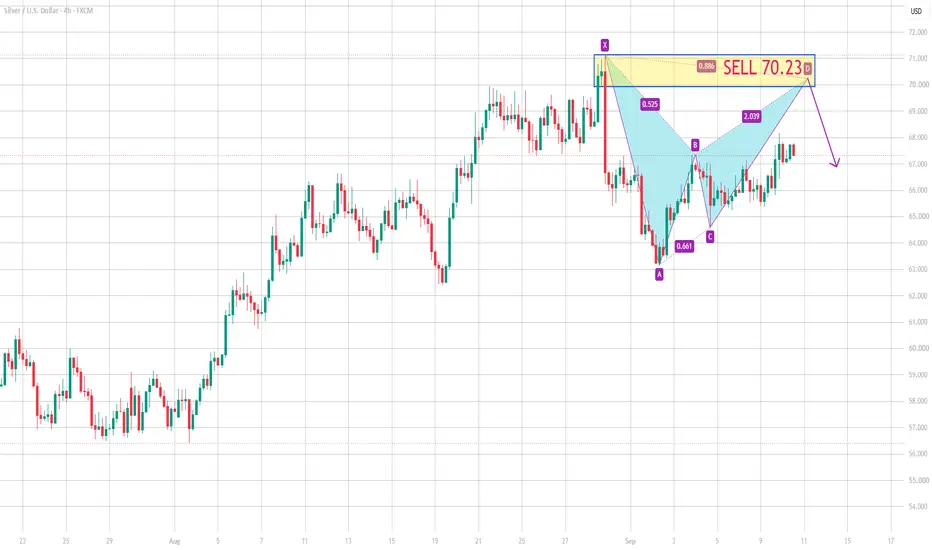
AUDUSD TP 0.7230On the daily chart, AUDUSD has stabilized and is trending upwards, with bulls currently in control in the short term. The upside resistance level to watch is around 0.7230; a move above this level could trigger a potential bearish bat pattern, and this area also falls within a previous supply zone.
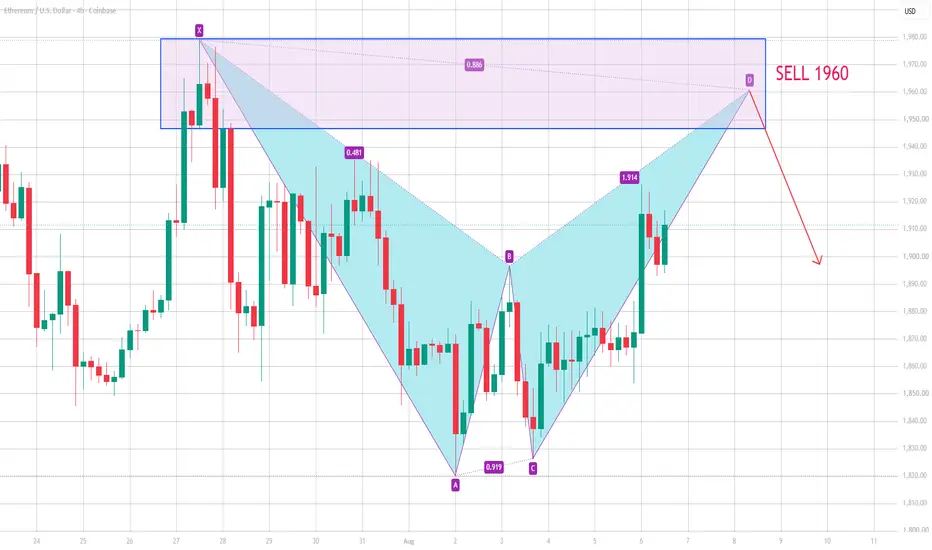
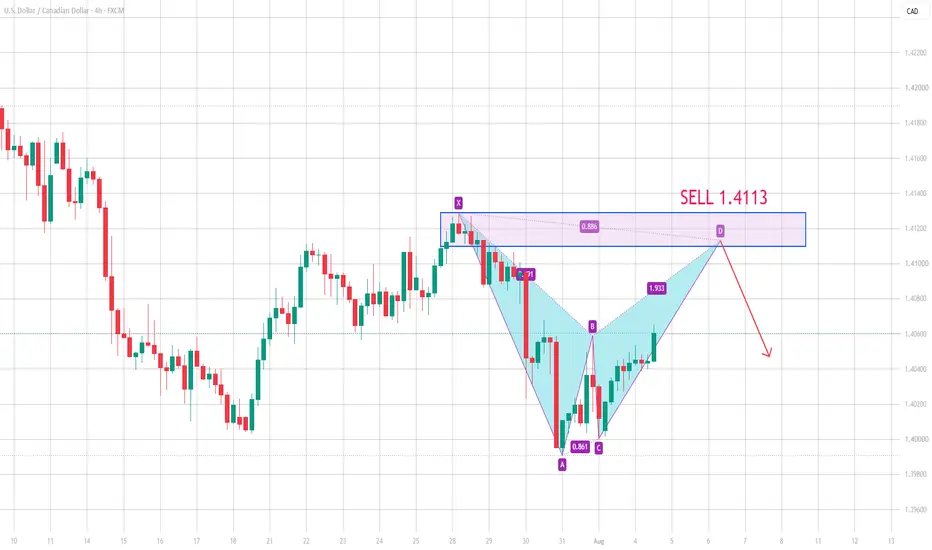
EURUSD SELL 1.1588 On the daily chart, EURUSD has stabilized and rebounded in the short term. Currently, attention should be paid to the resistance around 1.1588, a potential shorting entry point for a bearish bat pattern, which also falls within a previous supply zone. A break above the resistance around 1.1622 would invalidate the bearish bat pattern.
USOIL has formed a bearish Bat patternOn the 4-hour chart, USOIL faced resistance and pulled back after testing a previous supply zone, with short-term price action forming a potential bearish Bat pattern. Short positions may be considered, targeting the 78.6 level. A breakout above the resistance near 85.4 would signal a return to a bullish trend.
Gold Had a BIG Week… But I’m Watching This Level CloselyGold had quite the week.
Between the ongoing U.S.-Iran headlines and the dovish reaction from the U.S. dollar following Friday’s underwhelming Non-Farm Payroll report, there was plenty of fuel behind gold’s move higher.
But here’s the interesting part…
I’m actually watching for a potential short-term pullback in gold.
And there are two technical reasons why.
First, price is running directly into a previous level of structure.
This isn’t just any random level, either. It’s an area that prev
Why This BAT Pattern Stands Out From the Rest The BAT pattern is one of my favorite harmonic trading patterns as its deep D-point completion often creates exceptional risk-to-reward opportunities for traders willing to fade the prevailing trend.
What's even better about this setup it that this developing BAT pattern aligns with a major structure zone, adding another layer of technical confluence to the idea.
2 QUICK REMINDERS
1) Please remember that harmonic patterns are counter-trend by nature so the expectation isn't to try and ride
Bullish Points in HUBCHUBC Analysis
Closed at 219.38 (21-07-2026)
Positive Points:
> Bullish Divergence
> Bullish Bat Pattern
Current Range (214 - 219) seems to be a Good Support Zone.
Potential to move upside towards 224 - 226 initially.
It should not break 210.
On a bigger tf, it is also making Bullish Flag Pattern.
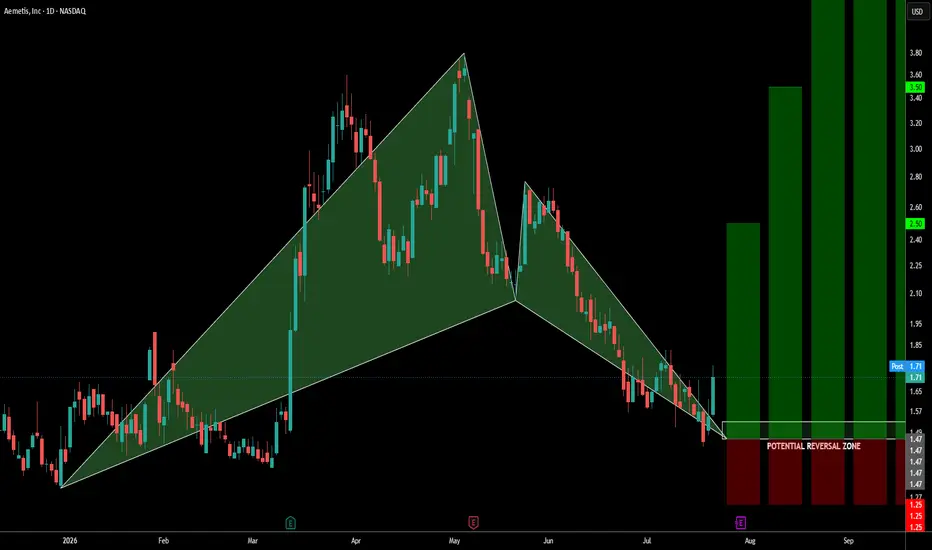
AMTX: Bullish Bat Pattern Signals a Potential ReversalAMTX has reached a key Potential Reversal Zone (PRZ) between $1.45 and $1.50, where a Bullish Bat Harmonic Pattern has completed. After an extended decline, this area could mark the beginning of a trend reversal if buyers step in and confirm the move.
Trade Setup
Potential Reversal Zone: $1.45–$1.50
Entry: Wait for a bullish confirmation above $1.50, or consider scaling into a position within the PRZ.
Stop Loss: Below $1.25.
Profit Targets: $2.50, $3.50, $5.00, $10.00, and $14.50.
The setup o