Bill Williams Indicators
Long Term Ethereum Analysis | Stay Cautious! (3D)⚠️ Before anything else, pay close attention to the analysis timeframe. This is a 3 day timeframe, meaning the setup is long-term in nature and may take time to develop.
From the point where we marked the red arrow on the chart, Ethereum's correction appears to have begun.
This correction looks like either a diametric pattern or an expanding triangle. In either case, wave E is typically one of the strongest waves within these formations. Considering the structure of most altcoin charts, it wou
ETH -1800+ Day Ascending Triangle!Ethereum on the weekly timeframe is showing a massive long-term ascending triangle structure that has been developing for more than 1800 days. This pattern reflects strong macro accumulation, with price consistently printing higher lows while facing heavy resistance near the $4.5K–$4.8K zone.
The ascending support trendline continues to hold firmly, suggesting buyers are stepping in at increasingly higher prices. Historically, long-duration triangle formations often lead to explosive breakouts o
ETHUSD H4 | Bearish Continuation SetupThe price is rising to our sell entry level at 2,080.50, which is a pullback resistance that is slightly above the 23.6% Fibonacci retracement.
Our stop loss is set at 2,155.98, which is an overlap resistance that is slightly below the 50% Fibonacci retracement.
Our take profit is set at 1,981.43, which is a multi-swing low support.
High Risk Investment Warning
Stratos Markets Limited fxcm.com Stratos Europe Ltd fxcm.com
CFDs are complex instruments and come with a high risk of losing money
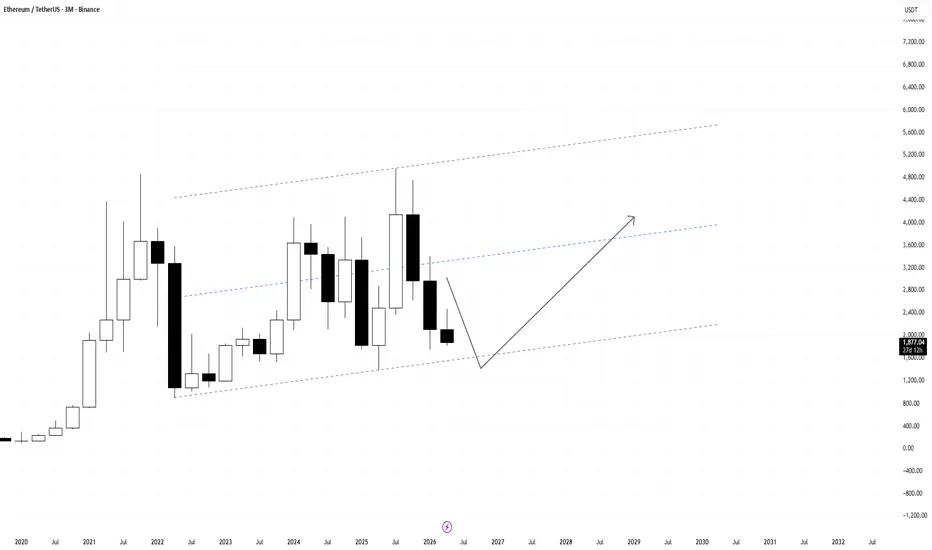
Ethereum is trading near its 4 year support trendline It may be interesting to know that Ethereum is approaching its 4-year trendline support. The $1,600–$1,700 zone is a key support area for Ethereum, and bulls are expected to defend this range.
An educational point about trendlines is that if the swing points (origins) used to draw a trendline have broken previous highs (BOS), that trendline is generally considered stronger and more reliable. In this case, both swing origins have successfully broken previous highs, which adds further validity an
Investment Rationale for EthereumEthereum is the leading smart contract platform and the foundation of a large portion of the decentralized finance (DeFi), NFT, and blockchain application ecosystem. Its strong network effects, active developer community, and continuous technological improvements position it as a key infrastructure layer for the future digital economy.
Ethereum represents the dominant programmable blockchain ecosystem, securing billions of dollars in digital assets and supporting thousands of decentralized appl
ETHEREUM crashing. Can it reach $1000?Ethereum (ETHUSD) is on an aggressive 4-week sell-off following the rejection on its 1W MA200 (orange trend-line). As we explained on our last month analysis, this was to be expected as the Bear Cycle has been trading within a Channel Down and the rejection would initiate it's 3rd main Bearish Leg.
With the previous two falling by around the same degree (-47.03% and -48.69%) we expect at least the same extent on the current one, targeting the April 09 2025 Low at $1390. That is the minimum Targ
ETHUSD support retest at 1966ETHUSD continues to trade within the broader prevailing trend, with recent price action showing signs of a corrective pullback phase.
Key Level: 2060
This area previously acted as a consolidation zone and is currently being monitored as a notable resistance level.
Scenario Below 2060
If price remains below 2060, market structure may continue to reflect near-term downside pressure. In this context, the following levels may act as reference support areas:
1966 – Near-term support
1923 – Interme
ETHUSD Bearish Trendline Breakdown – Sellers Eye Lower SupportETHUSD has broken below a rising trendline support, signaling a potential continuation of the broader bearish trend. After multiple attempts to hold above the ascending structure, sellers gained control and pushed price beneath both trendline support and the nearby Ichimoku cloud region.
The rejection from the **2,020–2,030** area highlights weakening bullish momentum, while price remains below the key resistance level at **2,083.53**. As long as Ethereum trades under these resistance zones, do
ETH/BTC Continuation Acceleration Protocol (CAP) BreakoutContinuation Acceleration Protocol (CAP) status: watching for breakout confirmation.
Structure:
Ξ/₿ has completed a textbook ABC correction on declining volume following a sharp impulse move off the 0.02749 Fibonacci 1.272 extension low. Price is now retesting the upper boundary of a 9-month descending wedge. The correction printed on the lowest volume of the entire structure, a classic sign of exhausted selling rather than sustained distribution.
Gate 1 - Regime: Descending wedge nearing apex
The bearish cycle of ETHEREUM will continue (12H)Note: Ethereum’s trend is bearish, and a rebound to the upside is not guaranteed. We are not looking for long (buy) positions!
If you followed our previous analyses, you would know that we were very bearish on Ethereum!
In this update, we’ve made the chart cleaner.
Now, after such a strong drop, opening a short position comes with its own risks unless either the price gives a solid upward correction or we receive strong confirmation signals again.
At the moment, we are not looking to take a
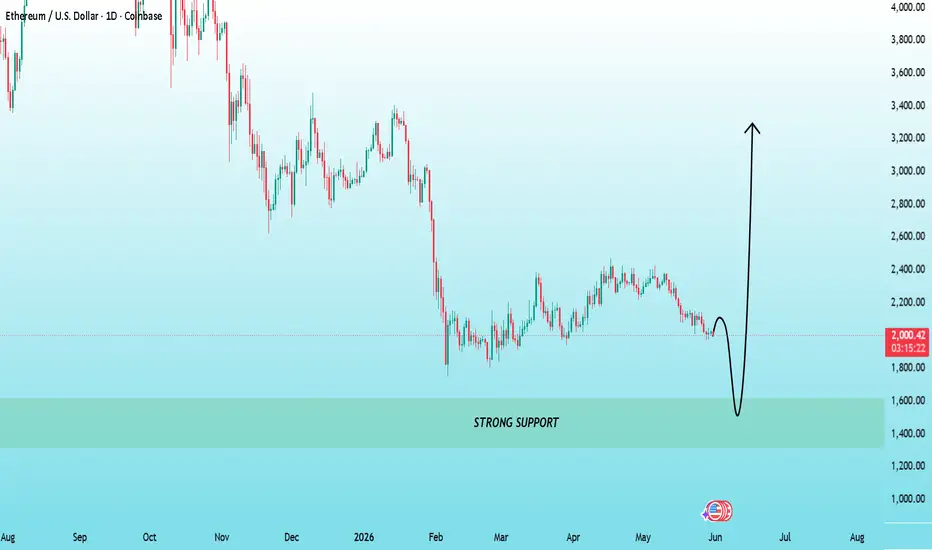
ETHUSD Major Support Zone Could Trigger the Next Bullish MoveEthereum is approaching a critical demand zone between $1,300 and $1,600, an area that has historically attracted strong buying interest. After a prolonged correction, price is nearing a key support region where buyers may step in and reverse the current downtrend.
📊 Technical Outlook:
* Price is testing a major support zone.
* Market structure suggests a potential accumulation phase.
* A sweep below support followed by a strong recovery could create an attractive bullish setup.
* Risk-to-rewa
ETH Daily: Testing the 0.618–0.65 Retracement ZoneBITSTAMP:ETHUSD daily
Price is testing an interesting area after the pullback from the April / May highs.
The local retracement has now moved into the 0.618–0.65 fib zone (golden pocket) around 1,990–1,968. This is a reasonable area for buyers to try to step back in, but the structure is not confirmed yet.
The first level I would want to see reclaimed is the 0.5 fib around 2,073.
Above that, the more important test sits around 2,117–2,160. Reclaiming that area would improve the short-ter
ETH/USD Bullish Trendline Support Signals Upside ContinuationEthereum (ETH/USD) is trading above a well-defined ascending trendline after establishing a series of higher lows from the recent bottom near the 1,970 area. The market has respected trendline support multiple times, indicating that buyers remain in control of the short-term structure.
Following the recent consolidation around the 2,020 level, price appears poised for a continuation move higher. If the ascending support remains intact, ETH could climb toward the next key resistance zone around
ETH Bulls Need 2142ETH At a Decision Level
ETH moving to the downside and now the chart is sitting at a pretty important decision area.
The main level for me is 2142.
That is the level bulls need to break back above and flip into support if this downside structure is going to look more complete.
There is a bull version where ETH has already completed a zigzag down, even though it did break the base channel. I can see that argument, but I do not want to force it too early.
The other path is that 2142 acts as r
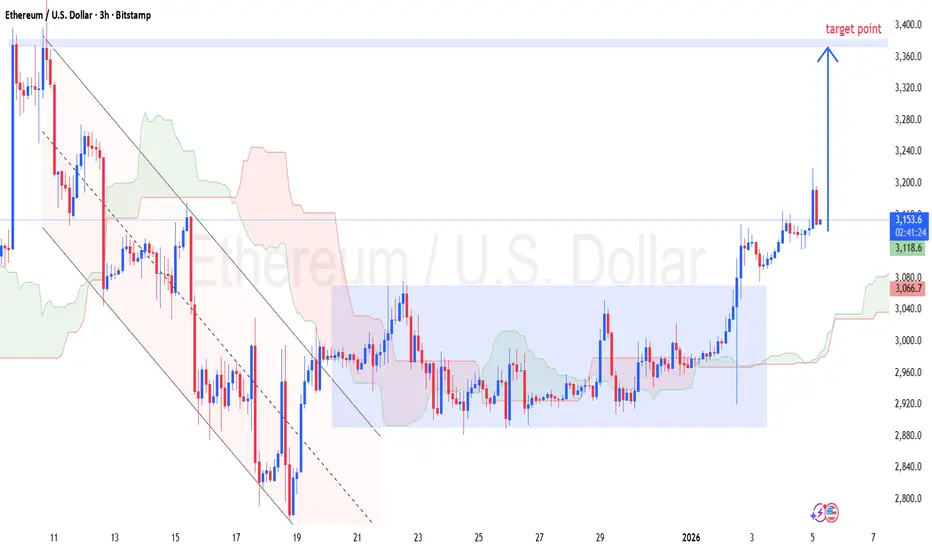
ETHUSD (3H) –Chart Pattern...ETHUSD (3H) –Chart Pattern
✅ BUY
Entry: 3,140 – 3,160
Stop Loss: 3,060
TARGET: 3,380 🎯
Reason (simple):
Price has broken above consolidation + cloud support and is making higher highs. Momentum favors continuation toward the marked resistance zone around 3,380.
👉 If price closes below 3,060 → setup invalid.
One trade, one target. No confusion.
ETHUSD (4H) — When Wave Symmetry Speaks (Log Scale) | Elliott WaETHUSD (4H) — When Wave Symmetry Speaks (Log Scale) | Elliott Wave Roadmap
Greetings to the global trading community,
On the 4H ETHUSD chart, this is not a signal — it’s a structure-based roadmap built on the rules and guidelines of Elliott Wave Principle, reviewed step by step to keep the wave count objective and valid.
From the perspective of Wave relationships, one detail stands out clearly on the logarithmic scale:
the market shows a strong equality relationship between Wave 1 and Wave 3.
ETHBTC Ratio: The Elusive 7 year MONSTER SQUEEZE BULL SEASON ON!
ALT season don't come too often -- and most of the time, for most traders they are vacuumed into a guessing game on when that elusive monster season will come again. Correction can be hefty and painful -- and one wrong step may lead to decay of precious time and most importantly money, unless you are are a hardcore hodler who couldn't care less of the micro movements of the market, and just buy in intervals every month.
BTC as a case study has gone crazy parabolic to heavens level to 120k fr
Ethereum Shows Strong Bearish Pressure Across All Timeframes !This analysis is an update to the previous analysis shown in the related publications section.
According to the previous analysis, price dropped 11% from the identified supply zone.
Our overall outlook on Ethereum remains bearish, and we believe the recent upward move was an expanding triangle that has now completed.
We have marked a new supply zone, and if Ethereum reaches it, we expect it to face renewed selling pressure.
We have also mapped out the expected price movements on the chart, a
ETHUSD corrective pullback resistance at 2060ETHUSD continues to trade within the broader prevailing trend, with recent price action showing signs of a corrective pullback phase.
Key Level: 2060
This area previously acted as a consolidation zone and is currently being monitored as a notable resistance level.
Scenario Below 2060
If price remains below 2060, market structure may continue to reflect near-term downside pressure. In this context, the following levels may act as reference support areas:
1966 – Near-term support
1923 – Interme
ETHUSDT: $4800 As A Final Swing Target, Has ETH Become A Past? ETH has faced significant challenges since reaching its record high of $4800. Following this surge, the price has struggled, consolidating and then dropping. However, we might see a final price drop before it stabilises between $1400 and $1600. This range suggests the most potential for swing buy opportunities. It would be wise to wait for a strong price signal alongside confirmation before entering a buy position in this strong sell. This move could potentially eliminate your existing sell
BTCUSD H4 | Bullish Bounce Off 61.8% Fib ResistanceBased on the H4 chart analysis, we can see that the price has bounced off our buy entry level at 72,423.15, which is a pullback support that aligns with the 61.8% Fibonacci retracement.
Our stop loss is set at 70,753.08, which is a pullback support.
Our take profit is set at 75,397.97, which is a pullback resistance.
High Risk Investment Warning
Stratos Markets Limited fxcm.com Stratos Europe Ltd fxcm.com
CFDs are complex instruments and come with a high risk of losing money rapidly due to l