AIRR — Bullish Cypher + Elliott Wave ABC CorrectionAIRR is approaching an important confluence zone between $98.50 and $100.00, where the Bullish Cypher Potential Reversal Zone lines up with the projected completion of an Elliott Wave ABC correction.
Price has been moving lower inside a corrective channel, which gives the current decline the structure of a possible ABC correction. What makes this setup interesting is that the projected Wave C is ending near the PRZ, while the 1:1 extension from Wave A to Wave C also lines up with this same area.
Trade Setup
Entry: $98.50–$100.00
Stop Loss: $92.00
TP1: $118
TP2: $127
TP3: $140
TP4: $155
The $98.50–$100.00 zone is the area to watch for confirmation. I don't want to assume the reversal simply because price reaches the PRZ.
If AIRR holds this zone, rejects lower prices, and starts breaking out of the corrective channel, that would provide stronger confirmation that Wave C may be complete and the Bullish Cypher is beginning to play out.
A break below $92.00 would invalidate the setup.
Bullish Cypher + ABC correction + 1:1 A-to-C extension all coming together around $98.50–$100.00 makes this a key area to watch. Now the confirmation is the most important part.
Bullish Cypher
SMR: Bullish Cypher Setting Up on the Weekly ChartSMR is approaching an interesting area on the weekly chart, where a Bullish Cypher Harmonic Pattern is completing.
This chart is plotted on a LOG SCALE, which is important when looking at the larger price targets and percentage moves.
The Setup
The Potential Reversal Zone (PRZ) is around the $3 mark
If price reacts positively from this area, I’ll be watching for a bullish reversal and confirmation that the Cypher is working.
Entry: Around $3-3.50.
Invalidation: Below $1.88
Upside Targets
If the reversal develops as expected, the potential targets are:
$14 → $25 → $45 → $90
The first target would be a major move from the PRZ, while the higher targets represent the longer-term potential of the pattern.
What I'm Watching
The $3 area is the key zone. If buyers step in and price begins reclaiming resistance, the Bullish Cypher becomes much more interesting.
This is a long-term weekly setup, not a prediction that price will immediately move higher. The pattern needs confirmation.
SMR + Bullish Cypher + Weekly LOG Scale = a setup worth watching.
Pfizer’s Cypher Setup: The Yellow Trend Line Could Hold the Key Pfizer is approaching one of the most technically important areas on its long-term monthly chart.
The setup is built around a bullish Cypher harmonic pattern, with the projected completion occurring inside a major potential reversal zone around the $17.50 area. But the harmonic pattern is only part of the story.
The real significance of this chart may be the long-term yellow trend line.
## The Yellow Trend Line: A Decades-Long Technical Battlefield
The yellow trend line is not simply another line drawn across the chart. It has repeatedly demonstrated its importance by acting as both support and resistance over the years.
Price has interacted with this trend line at multiple major turning points. When price has approached it from above, the line has had the ability to provide support. When price has moved beneath or into the area from below, the same line has acted as resistance.
That transformation from support to resistance, and resistance back to support, is what makes this trend line so important.
Now Pfizer is moving toward another potential interaction with this long-term level.
If the yellow trend line once again behaves as meaningful support, it could become the catalyst for a much larger reversal.
## The Bullish Cypher Pattern
The harmonic structure shown on the chart points toward a bullish Cypher completion near the $17.50 area.
That region represents the potential reversal zone where the pattern could complete and where the risk-to-reward profile becomes particularly interesting.
The setup is therefore not simply based on Pfizer being oversold or trading at a historically depressed price. It is based on the convergence of several technical factors:
* A long-term bullish Cypher harmonic structure
* The projected completion of the pattern near $17.50
* The long-term yellow trend line
* A historically important support and resistance structure
* A defined invalidation level below the reversal zone
This convergence is what makes the $17.50 region particularly significant.
## Entry: The Potential Reversal Zone
The primary entry area shown on the chart is approximately $17.50.
This is the area where the Cypher pattern is projected to complete and where the yellow trend line becomes especially important.
Rather than viewing $17.50 as just another price level, it should be viewed as the potential battleground between the long-term bearish trend and a possible new bullish cycle.
A successful reaction from this area would strengthen the bullish harmonic thesis.
## Invalidation: $11
The chart places the invalidation level around $11.
A decisive move below this area would substantially weaken or invalidate the bullish Cypher thesis shown here.
That level is important because the entire reversal thesis depends on the projected harmonic structure holding within its completion zone. If price moves substantially beyond that structure, the pattern no longer carries the same technical significance.
## The Upside Targets
If the reversal develops as anticipated, the chart identifies several major upside objectives.
The first major target is approximately $40.
From there, the chart projects additional targets around:
**$51**
**$65**
**$85**
These targets represent progressively larger upside objectives rather than a single fixed destination.
A move from the projected $17.50 reversal area toward $40 would already represent a substantial recovery. A continuation toward $51 and $65 would indicate that the reversal had developed into a much larger trend change.
The ultimate projection on the chart reaches approximately $85.
## Why the Yellow Line Matters More Than Anything
The most important message of this chart may not actually be the Cypher pattern itself.
It is the relationship between the Cypher completion and the yellow trend line.
Harmonic patterns can identify potential reversal zones, but confirmation comes from price behavior.
That is where the yellow trend line becomes critical.
If Pfizer reaches the projected reversal area and the yellow trend line once again transforms into support, the technical picture becomes considerably more compelling.
The market would effectively be saying that this decades-long level still matters.
And if that support produces a sustained reversal, the $17.50 area could eventually be remembered as the foundation of a much larger Pfizer recovery.
## The Bigger Picture
Pfizer has spent years developing the structure shown on this monthly chart. The potential Cypher completion is therefore being presented against a much larger historical backdrop.
The setup is straightforward:
**Potential Entry:** ~$17.50
**Invalidation:** ~$11
**Target 1:** ~$40
**Target 2:** ~$51
**Target 3:** ~$65
**Target 4:** ~$85
The key question is whether Pfizer can reach the projected reversal zone and, most importantly, whether the yellow trend line once again proves that it deserves the respect it has earned over decades of price action.
If it does, this may be far more than a simple bounce.
It could mark the beginning of a major long-term reversal.
The $17.50 area is therefore the level to watch. The Cypher identifies the potential reversal. The yellow trend line provides the historical context. And price action at that intersection will ultimately determine whether this setup becomes one of Pfizer’s most significant long-term turning points.
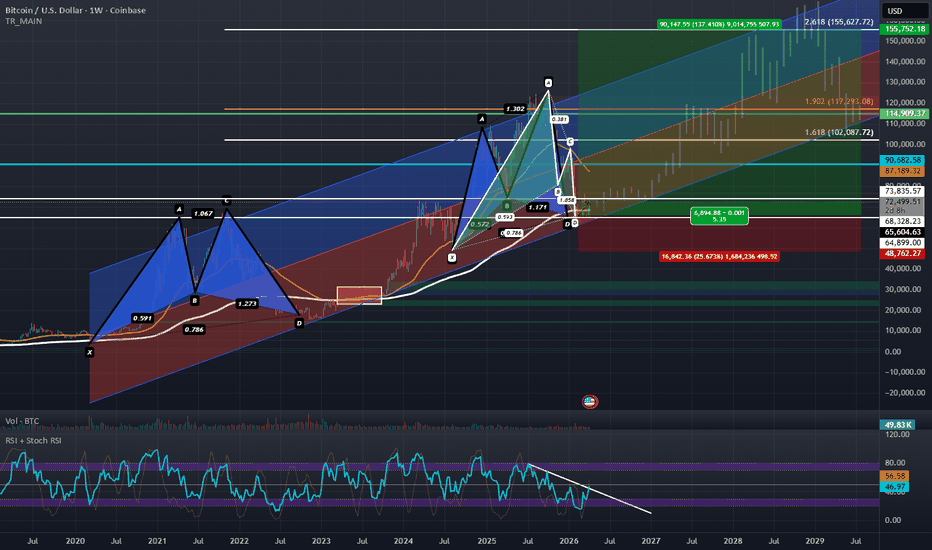
BTCUSD: Bullish Gartley Support Confirmed Targeting $155,627.72This is a follow-up to the previous bullish entry idea from 2 months ago at the bottom of the channel.
Over the last several weeks BTC has been putting in a bottom at the bottom of this channel both in terms of putting in a Double Bottom on the weekly timeframe and confirming a Bullish Inverted Hammer on last month's Monthly Close; in this time BTC has been taking back the 200-week moving average and given that BTC rarely stays below the 200-week Moving Average for long it is statistically likely that BTC begins a new bull cycle from here. We've also seen a significant rise in Demand Deposits and Physical Currency in Circulation which is likely to lead to this new money chasing fixed supply assets which is a category BTC fits perfectly into.
This macro bottom aligns with the combined PCZ of a Bullish Cypher and Bullish Gartley and seems to be setting up to repeat the end of the 2021-2022 Cycle Top to Bottom Fractal and is trading above the previous Cycle Highs. If this Cycle ends like it did in 2022 we should begin a new uptrend that can take BTC all the way up to the 2.618 Fibonacci Extension at the top of the Linear Regression Channel which aligns wit the $155,672.72 area.
It would seem that Bitcoin is trading around the previous Cycle High Horizontal Support/Resistance Zone. BTC has been holding above the lower end of the zone at $64,899.00 and has been finding resistance at upper end of the zone at $73,835.57, BTC is yet to break above the upper end of this zone but if it does BTC will likely be able to begin it's next major move to the LOBF (the middle line of the channel) where it might then find resistance but if it manages to push above that level too it could later rise to the 2.618 and perhaps even the 3.168-3.618 Extensions before pulling back.
The RSI has also begun to break free from it's downtrend and lastly the USDT.D has been showing some signs of potential weakness as explained here:
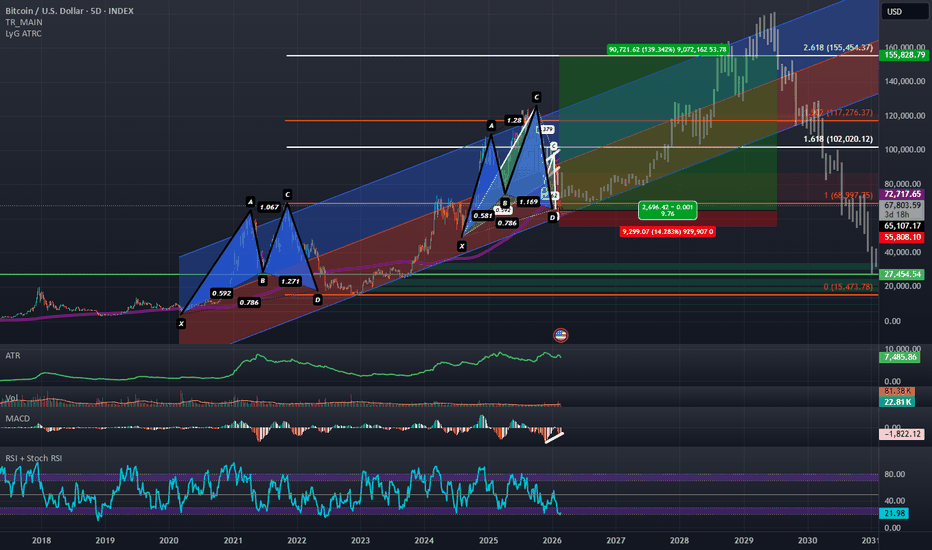
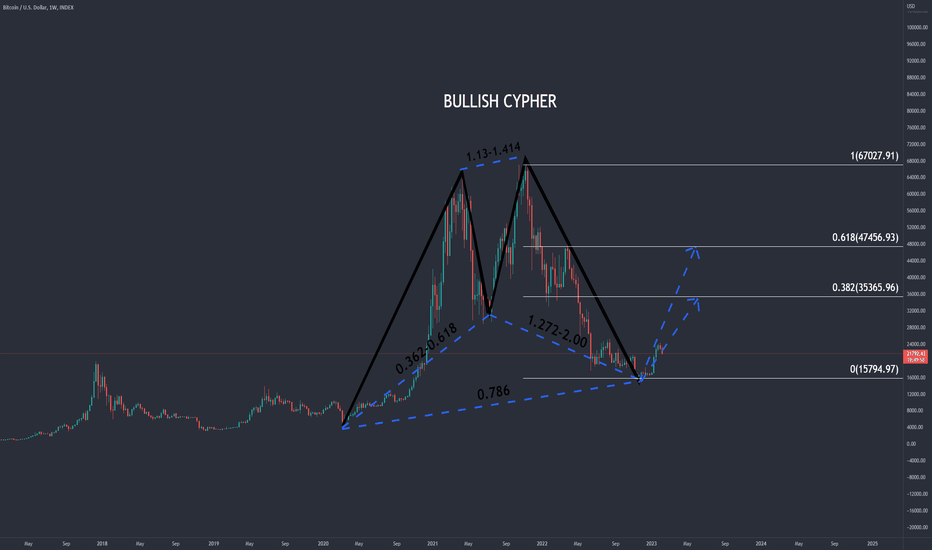
Bullish 2021 Bitcoin Fractal Suggests Bitcoin has BottomedBitcoin is sitting at the PCZ of a what can be plotted as both a Bullish Cypher and a Bullish gartley and on the 5D timeframe it is below the 200 Period SMA which it usually doesn't stay below for long; and is also sitting a the 1.618 Standard Deviation demand line of a Linear regression Channel while exhibiting Bullish Divergence on the MACD and starting to show a second recovery from oversold zones in the RSI after what was a sharp secondary decline into oversold zones and lastly on the price decline, the ATR spiked up but has since started to return back to where it came from which signals the downside volatility might be waning here.
All of this suggests to me that on a technical level Bitcoin has indeed bottomed and if we are to complete the same harmonic fractal as we did leading to and during the completion of out last Bullish Cypher in 2020-2022, our next target would align with the 2.618 Fibonacci Extension which happens to be around the top of the channel BTC has developed over the years and would also bring BTC back on track to keeping up with the SPX which has already reached its 2.618 extension and may be headed for the 3.168 extension next as seen in this fractal of the SPX here:
The other week I closed my shorts on BTC and started to position for a deadcat-bounce with a target around 106k but upon looking back at some older charts and targets and seeing the Japanese Inflation numbers read below 2%, I came to the conclusion that BTC might be enabled to rise and complete its fractal fully which would take it to the 2.618 extension and given all the confluence at both the current entry and potential future exit I think it will probably be a good idea to raise the full profit taking target to $155.4k
Once BTC catches up with the SPX in terms of extensions and fractal completions; this may then lead to the ultimate decline in both Bitcoin and the S&P-500, but that bearish angle is just me thinking further ahead. For now and for the time being I will be focused on the Bullish higher Bullish targets.
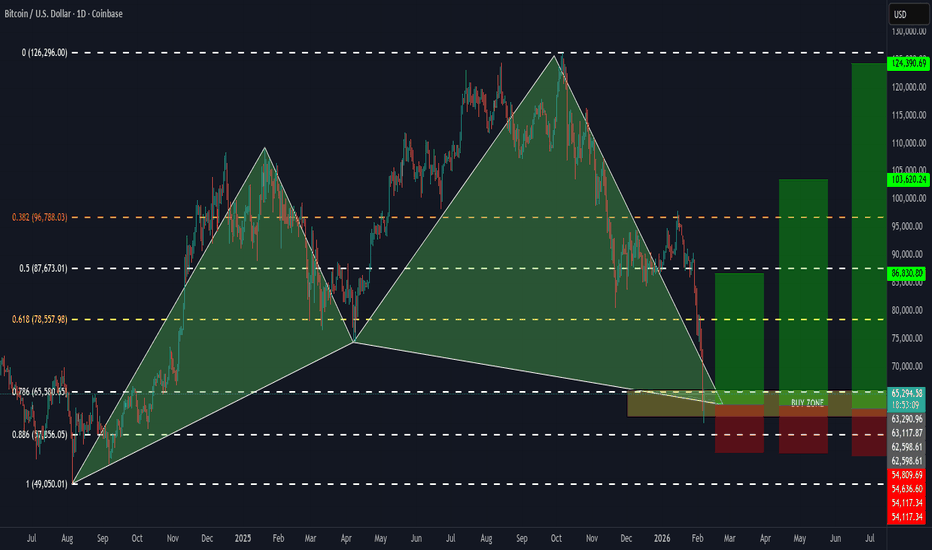
BTC BULLISH CYPHERStructure of the Cypher Pattern
A valid bullish Cypher follows this sequence:
X → A: Strong impulsive rally
A → B: Deep retracement (typically 0.382–0.618 of XA)
B → C: Expansion beyond point X (usually 1.272–1.414 XA)
C → D: Final retracement to 0.786 of XC, where reversal is expected
Your chart aligns perfectly with this geometry.
Key Fibonacci Validation on the Chart
From the visual levels shown:
0.382 retracement: ~96,788
0.5 retracement: ~87,673
0.618 retracement: ~78,558
0.786 retracement (Cypher completion): ~63,000–65,000
0.886 extension: ~57,856 (failure threshold)
Price has rotated directly into the 0.786 XC retracement, confirming the Cypher’s Potential Reversal Zone (PRZ).
Buy Zone (PRZ – Accumulation Area)
Highlighted on the chart as “BUY ZONE”
📍 Buy Zone Range:
$63,000 – $66,000
Why this zone matters:
Aligns with 0.786 XC retracement
Sits above the 0.886 invalidation
Converges with prior structural support
Marks emotional capitulation after the C-leg blow-off
This is not a single-price entry—it’s a zone for scaling in, ideal for staggered buys or confirmation-based entries on lower timeframes.
Risk Management (Invalidation Level)
❌ Pattern Failure Below:
~$57,800
A decisive weekly close below the 0.886 level invalidates the Cypher and signals structural weakness. Any bullish thesis should be abandoned below this level.
Exit Zones (Profit Targets)
Your chart clearly plots measured harmonic expansions as upside objectives. These align with classic Cypher take-profit logic.
🎯 Target 1 – Conservative Exit
$86,800
Prior range midpoint
0.5 Fibonacci retracement of the larger move
Ideal for partial profit or breakeven adjustment
🎯 Target 2 – Primary Expansion
$103,600
Structural resistance
Common harmonic reaction level
Strong zone for trimming or trailing stops
🎯 Target 3 – Full Pattern Resolution
$124,000 – $126,000
Completion of projected harmonic expansion
Previous cycle high region
Optimal area for full exit or long-term distribution
Summary Table
Zone Price Area
Buy Zone (PRZ) $63K – $66K
Invalidation ~$57.8K
Target 1 ~$86.8K
Target 2 ~$103.6K
Target 3 ~$124K–$126K
Final Thoughts
This Cypher is structurally clean, well-proportioned, and forming on a weekly timeframe, which significantly increases its reliability. The market has already done what Cyphers demand—exhaust momentum beyond reason—and is now retracing into a mathematically defined accumulation zone.
If this pattern holds, the current region represents asymmetric risk, where downside is clearly defined and upside remains substantial.
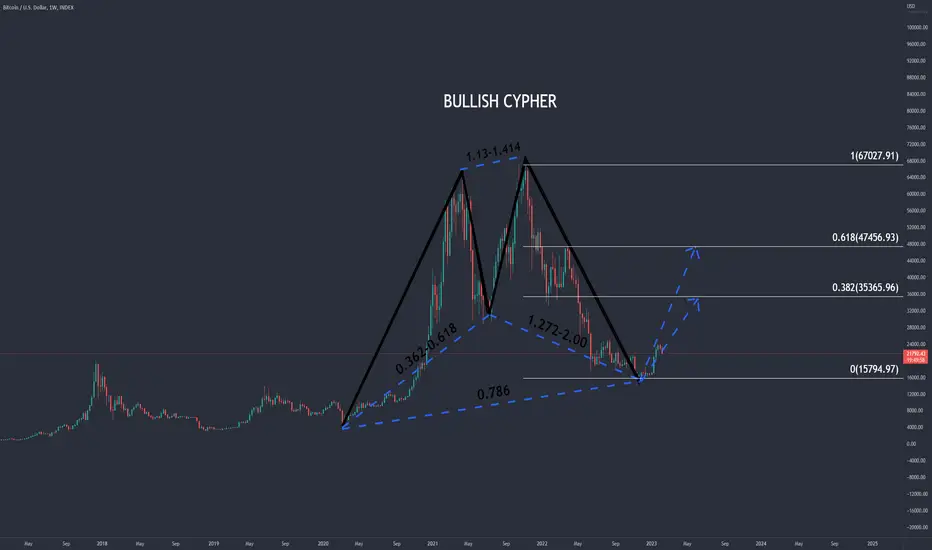
Bitcoin Cup and Handle?Owhooooo!
This weekly chart has me howling for the moon!
It seems like the Bullish Cypher is still playing out, and the giant Cup and Handle formation could be in play. If we do see a pullback, I think this would fit nicely into the overall continuation of the Bullish Cypher trend.
So I'll be looking for this pullback to form the handle, and my own personal strategy is to use this (if it happens) to accumulate MORE Bitcoin.
I'll be hiding in the bushes and waiting to see how this plays out.
What do you think will happen?
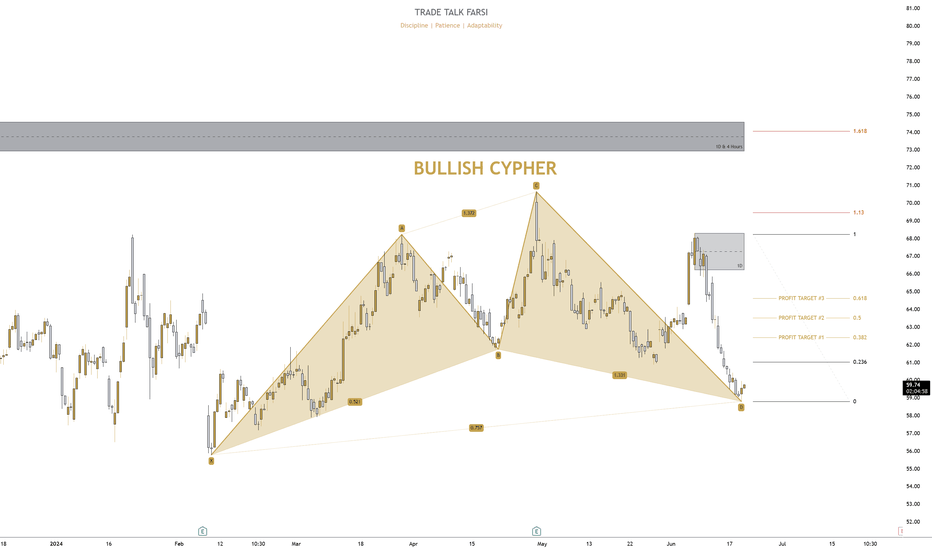
Raising EURUSD Profit Target to $1.114 due to a Bullish CypherDue to the apparent formation of a Bullish Cypher on the Daily, combined with the Bullish Push as confirmation on the RSI, and the strong push push in price action above the 200-day SMA, I will be raising my profit target for the EURUSD to the 100% retrace up at $1.114 as the 100% retrace would be the standard target for a Cypher and the TLT has outperformed which is usually a signal for psoitive price action in the EURUSD.
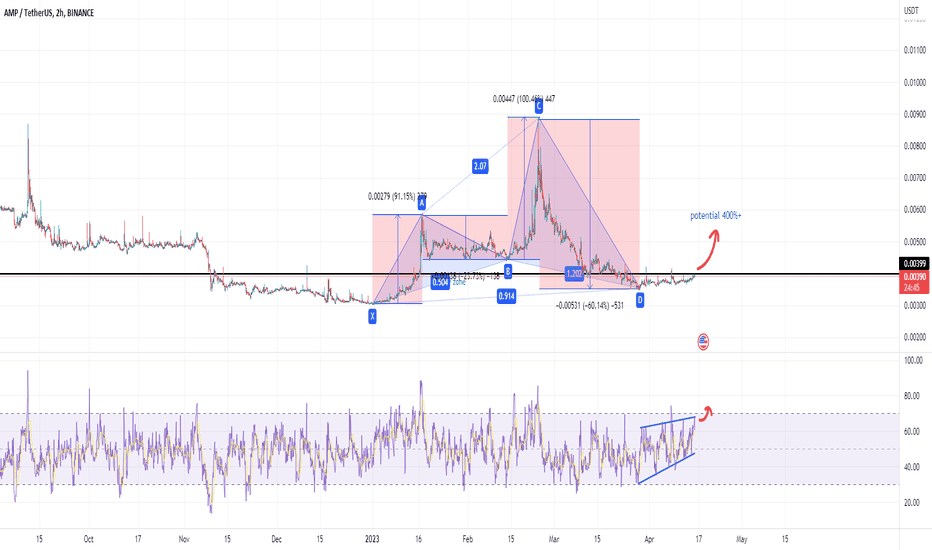
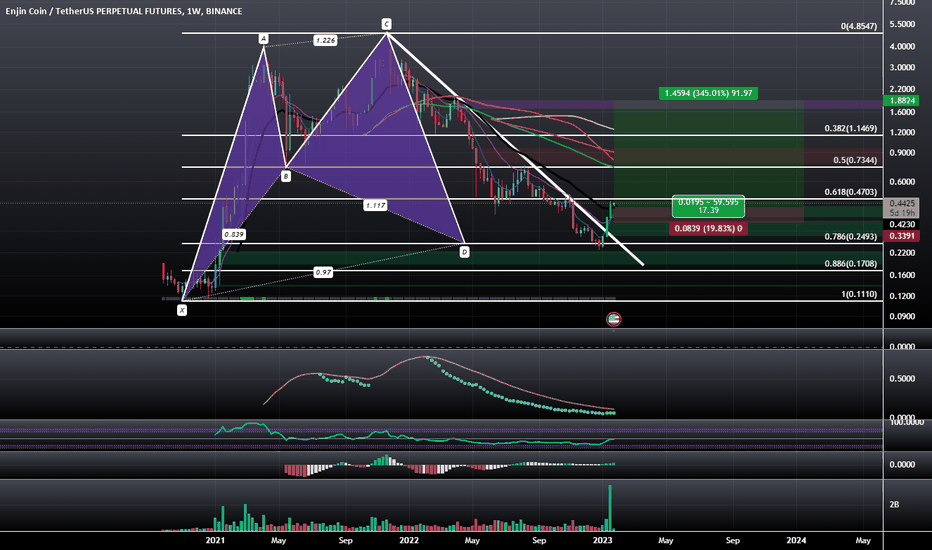
AMP Bullish harmonic cypher showing potential price outbreakHello
Today I bring you a harmonic cypher showing bullish signs on AMP.
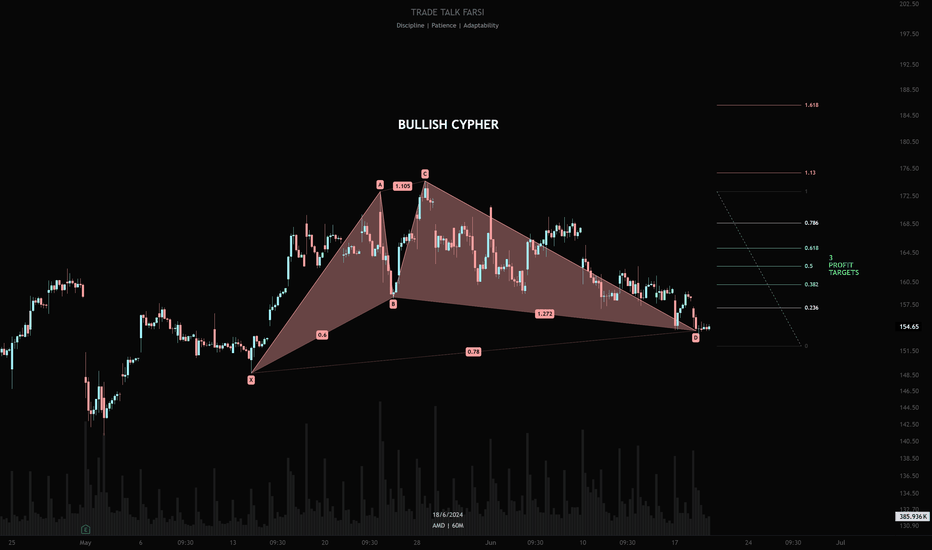
A typical harmonic cypher pattern is bullish IF:
The initial leg, the XA leg, rallies higher from the starting point at X.
The AB leg moves lower to retrace the XA leg. This retracement should bring prices to between the 38.2 to 61.8 percent level of the XA leg.
The BC leg moves higher and takes out the swing high at point A, and terminating between the 127.2 and 141.4 projection of the initial XA leg.
The CD leg moves lower and terminates near the 78.6% retracement level of the price move from point X to point C.
Upon the price reaching the 78.6% retracement level at point D, the bullish Cypher pattern is considered complete, and a price rise is expected.
The retracement percentage to point D did not reach past 70% but, despite this, all the other characteristics of the bullish harmonic cypher match the one on our chart.
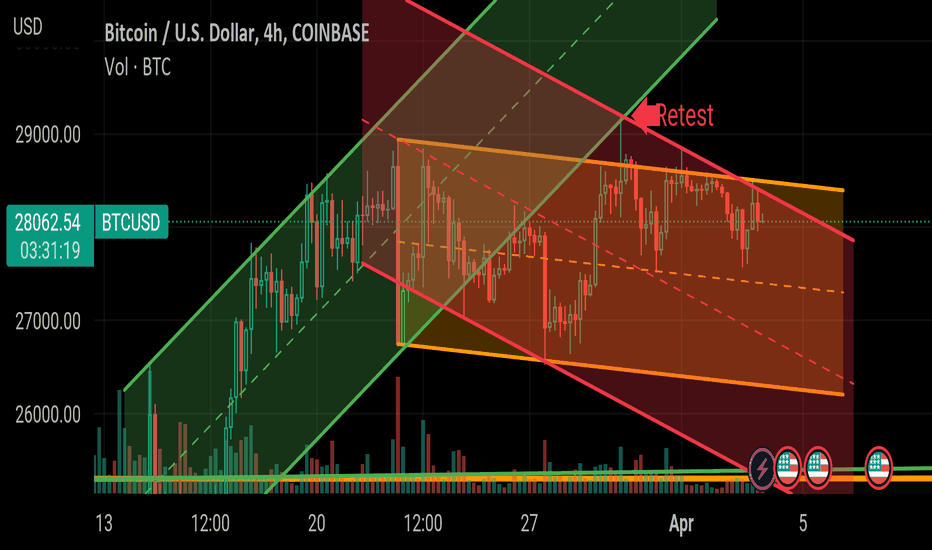
Rollover Parralel channel updateUpdate of the previous parralel channels post .
So far both our channels have played out well, apart from the retest and rejection from our green channel.
If the red channel plays out like the others we should start to see a steeper decline from this point on. 🤞
This would also fit the narrative of the cypher harmonic Iv been watching for (see other posts on my profile)
Any questions or if you don't agree please comment and let me know. Love a discussion
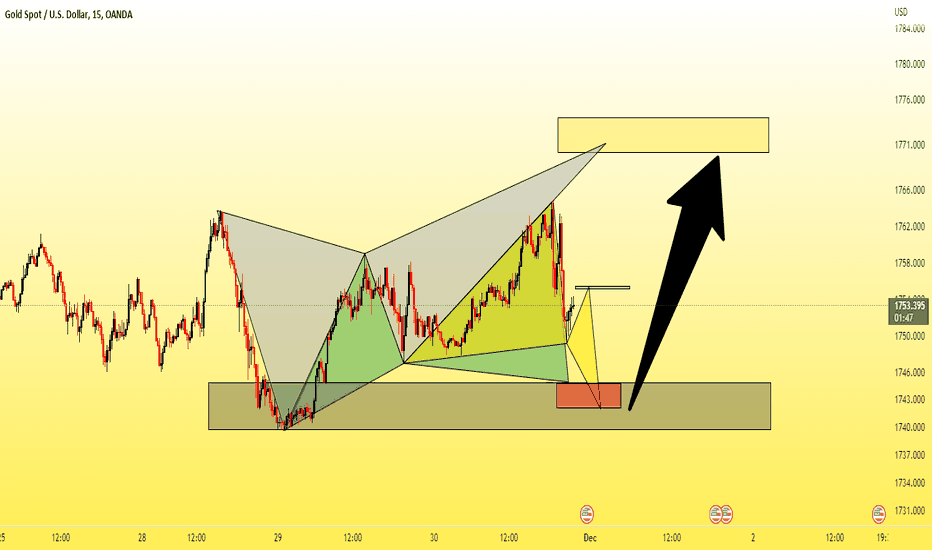
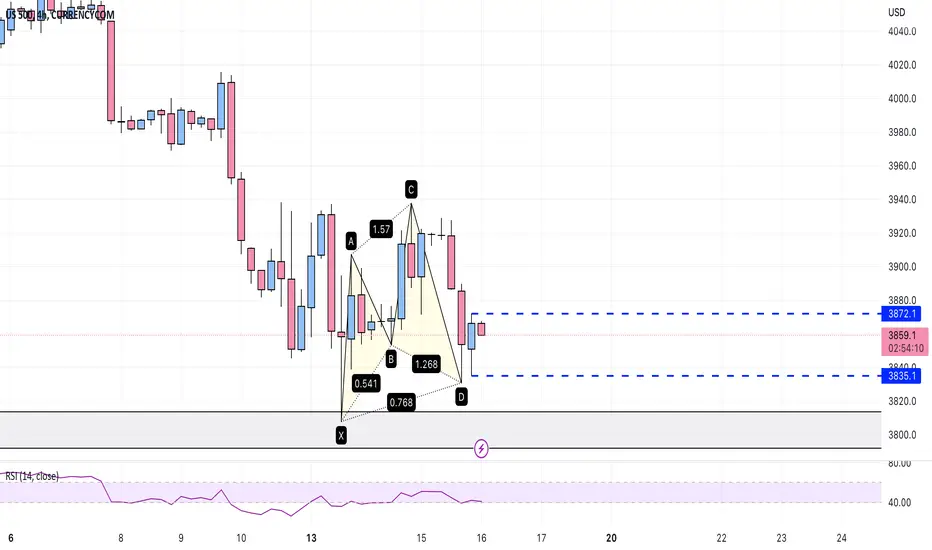
Cypher Completeif the next 4 hour candle is inside bar up, bullish continuation.
TP1: 3896
TP2: 3925
Stop Loss: 3830
Good Luck
ULong
USDCHF Long Position: Bullish WaveUSDCHF is ready to go bull.
I am anticipating a Motive Wave on the up-side.
Because of how it started, I am expecting an Ending Diagonal in Intermediate (C)(turquoise).
GOLD (XAUUSD), EURUSD, USDJPY and DXY are all showing Reversal Patterns.
Time to trade Wave Jedi!
My Swissie Technicals:
* Ending Diagonal in Intermediate (C) (red)
* Flat Correction in Intermediate (B)(turquoise)
* Hidden Bullish Divergence
* Harmonic Pattern: Bullish Cypher in Minute b (white)
* Triple Bottom Pattern
* 88.6% Fibonacci Retracement
* 127.2% Fibonacci Extension
USDCHF LONG Signal:
* Entry @ 0.9220
* SL @ 0.900
* TP1 @ 0.9560
* TP2 @ 0.9700
* TP3 @ 0.9785
* Safety Measure: when in the green, moving SL to BE.
* BUY Stops on the way up, after pull-backs.
Many pips ahead!
Richard, the Wave Jedi.
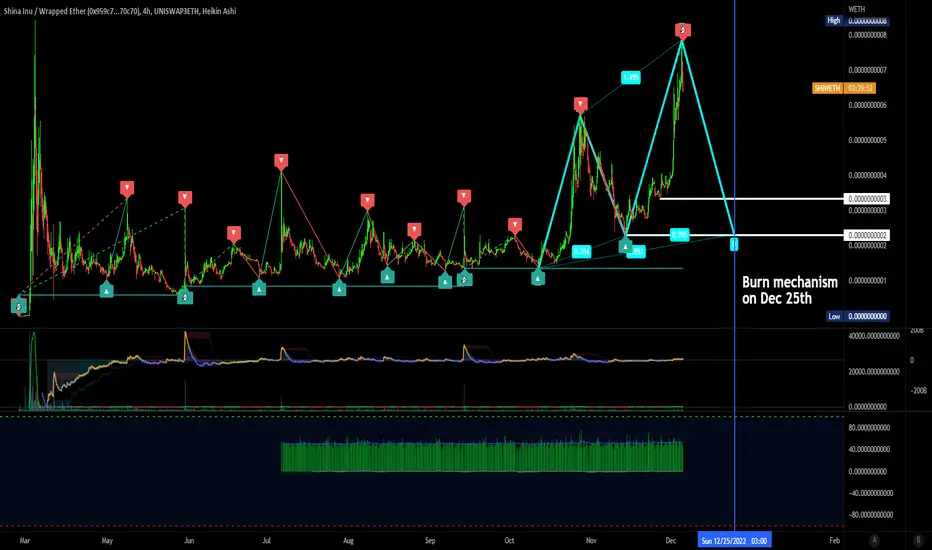
$SHIWETH Shina InuSHI Price Live Data
The live Shina Inu price today is $8.05e-7 USD with a 24-hour trading volume of $1,075,646 USD. We update our SHI to USD price in real-time. Shina Inu is down 2.27% in the last 24 hours. The current CoinMarketCap ranking is #2732, with a live market cap of not available. The circulating supply is not available and a max. supply of 20,000,000,000,000 SHI coins.
If you would like to know where to buy Shina Inu at the current rate, the top cryptocurrency exchanges for trading in Shina Inu stock are currently Uniswap (V3), Uniswap (V2), and ShibaSwap. You can find others listed on our crypto exchanges page.
"Shina Inu is a decentralized meme token on the Ethereum blockchain. Its mission is to give back to the crypto community, give to charity, and win the heart of the greatest token of all time, Shiba Inu!
Shina Token is a very fun meme token project that has sold many rare and beautiful NFTs. NFT sales are used to support the team and provide upcoming features such as exclusive access to events and rewards that will soon be announced."
SLong
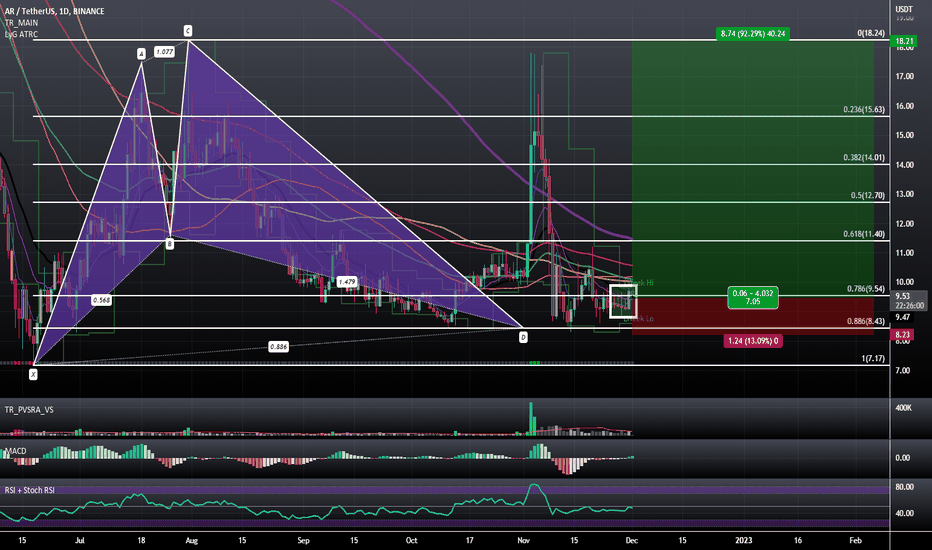
ARUSD: Bearish 3 Line Strike and a Close Above the 0.786 RetraceArweave today has simultaneously closed above the 0.786 retrace and has taken out the last 3-4 Days of Bearish Price Action on the Daily Timeframe.
We may also be at the PCZ of some sort of Deep Cypher Pattern; it can't be a Shark because the 1.618 Extension is nowhere near being reached so i think it's a Deep Cypher.