Silver's Bullish Gartley: Reversal Loading?Silver has entered a key Potential Reversal Zone (PRZ) as a Bullish Gartley pattern nears completion. This harmonic setup suggests selling pressure may be fading, creating conditions for a potential trend reversal.
If buyers step in and defend this support area, silver could begin a strong recovery toward higher resistance levels. With a favorable risk-to-reward profile and clearly defined invalidation levels, this is a technical setup worth watching closely.
A confirmed bounce from the PRZ could signal the start of the next bullish leg in silver.
Bullish Gartley
BULLISH GARTLEY SETUP DEVELOPING ON DASH/USDDash is on the verge of completing a bullish Gartley pattern on the daily chart.
To keep it simple, this could mark the beginning of the strongest bullish move Dash has seen in years.
Do what you want with this information. I'm simply sharing what I believe is a high-probability setup.
Blue pill or red pill—the choice is yours.
BTCUSD: Bullish Gartley Support Confirmed Targeting $155,627.72This is a follow-up to the previous bullish entry idea from 2 months ago at the bottom of the channel.
Over the last several weeks BTC has been putting in a bottom at the bottom of this channel both in terms of putting in a Double Bottom on the weekly timeframe and confirming a Bullish Inverted Hammer on last month's Monthly Close; in this time BTC has been taking back the 200-week moving average and given that BTC rarely stays below the 200-week Moving Average for long it is statistically likely that BTC begins a new bull cycle from here. We've also seen a significant rise in Demand Deposits and Physical Currency in Circulation which is likely to lead to this new money chasing fixed supply assets which is a category BTC fits perfectly into.
This macro bottom aligns with the combined PCZ of a Bullish Cypher and Bullish Gartley and seems to be setting up to repeat the end of the 2021-2022 Cycle Top to Bottom Fractal and is trading above the previous Cycle Highs. If this Cycle ends like it did in 2022 we should begin a new uptrend that can take BTC all the way up to the 2.618 Fibonacci Extension at the top of the Linear Regression Channel which aligns wit the $155,672.72 area.
It would seem that Bitcoin is trading around the previous Cycle High Horizontal Support/Resistance Zone. BTC has been holding above the lower end of the zone at $64,899.00 and has been finding resistance at upper end of the zone at $73,835.57, BTC is yet to break above the upper end of this zone but if it does BTC will likely be able to begin it's next major move to the LOBF (the middle line of the channel) where it might then find resistance but if it manages to push above that level too it could later rise to the 2.618 and perhaps even the 3.168-3.618 Extensions before pulling back.
The RSI has also begun to break free from it's downtrend and lastly the USDT.D has been showing some signs of potential weakness as explained here:
S&P-500 Futures Bullish Gartley Entry at 200-day SMAThe Nasdaq-100 Futures have been holding up in the range printing potential Bullish Cup with Handle Pattern but the SPX Futures have come down to nearly a 0.886 retrace, completing a Bullish Gartley aligning with the 200-day SMA.
Oil has recently spiked above $110 which was likely the trigger for the SPX's decline, but at this point is likely to come crashing back down below $100 if not just for a week or so.
During this time we can likely see the SPX stage a recovery from this recent decline as lower oil prices will lead to lower volatility(VIX), which will lead to a lower US Dollar Index, and higher equities and Bitcoin/Crypto.
I currently think we will see balance sheet expansion and that the market is going to price that in with one last blow-off top push to the upside as I detailed here:
This weekend's opening decline just simply serves as a more precise entry that one could even size up in the futures market. I think that it would make sense to take some profits near the top of the range at the 2.618 extension $6,921.75 but I also think that this could serve as the preferred entry into the bigger blow-off top move I'm suspecting can hit as high as $7.6-$9k as detailed in the higher timeframe idea above.
Taking Profit on BTC Shorts; Looking to Get Tiny Long ExposureOriginally Posted: 02/05/2026
Reposted For Compliance: 02/13/2026
BTC and MSTR are at potential PCZs of Bullish Gartley; The two assets moved down leading to MSTR earnings and negative unrealized losses expectations. I do think that BTC will ultimately move back down, but from where it is now, looking at all of the downside short leverage that has been building at these lower levels, I think there is a high chance of it short squeezing to the upside and for it to be fast and violent move up to around 90-106k before then confirming a lower high and going back down to even lower lows in a fashion similar to the green projection I have drawn out. Meanwhile we could see MSTR pump back to around $200. In this scenario I would see these pumps as nothing more than Bear Cat Bounces and would be looking to reenter my shorts on these bounces where we could then continue the main bearish trade. Here is a link to a chart of the original underlying bearish trade :
The short squeeze we could be set up for is something similar to what we got near the end of 2019 where BTC was in a bear trend but rallied 40% in 2 days within that bear trend before continuing much lower into 2020. Here is the chart focused around that time period:
At the time it was the greatest BTC short squeeze in the history of the asset yet despite how great it was it still ultimately went lower later so I will be on the lookout for this kind of movement once more as short positions accelerate not only at the bullish trendline but also at the PCZ of Bullish Gartleys on both MSTR and BTC.
I suspect MSTR could pump 20-40% from the PCZ and in terms of BTC I think we will get price action similar to what I have projected in the white brush marker.
I actually posted this last week but it was taken down by a mod so this is a repost which should now be compliant enough for them; Since then, BTC pumped 15% and MSTR is up over 20% but we have since pulled back decently towards the entry zone so there may be way more upside to go from here. However; I have mainly reposted this for archival purposes.
On a side note CLSK, another crypto miner looks like it could be set to rise from it's 0.886 PCZ of a Bullish Bat around 10 dollars all the way back up to around 18 dollars.
Bullish 2021 Bitcoin Fractal Suggests Bitcoin has BottomedBitcoin is sitting at the PCZ of a what can be plotted as both a Bullish Cypher and a Bullish gartley and on the 5D timeframe it is below the 200 Period SMA which it usually doesn't stay below for long; and is also sitting a the 1.618 Standard Deviation demand line of a Linear regression Channel while exhibiting Bullish Divergence on the MACD and starting to show a second recovery from oversold zones in the RSI after what was a sharp secondary decline into oversold zones and lastly on the price decline, the ATR spiked up but has since started to return back to where it came from which signals the downside volatility might be waning here.
All of this suggests to me that on a technical level Bitcoin has indeed bottomed and if we are to complete the same harmonic fractal as we did leading to and during the completion of out last Bullish Cypher in 2020-2022, our next target would align with the 2.618 Fibonacci Extension which happens to be around the top of the channel BTC has developed over the years and would also bring BTC back on track to keeping up with the SPX which has already reached its 2.618 extension and may be headed for the 3.168 extension next as seen in this fractal of the SPX here:
The other week I closed my shorts on BTC and started to position for a deadcat-bounce with a target around 106k but upon looking back at some older charts and targets and seeing the Japanese Inflation numbers read below 2%, I came to the conclusion that BTC might be enabled to rise and complete its fractal fully which would take it to the 2.618 extension and given all the confluence at both the current entry and potential future exit I think it will probably be a good idea to raise the full profit taking target to $155.4k
Once BTC catches up with the SPX in terms of extensions and fractal completions; this may then lead to the ultimate decline in both Bitcoin and the S&P-500, but that bearish angle is just me thinking further ahead. For now and for the time being I will be focused on the Bullish higher Bullish targets.
ETHUSD: Bullish Gartley with Bullish Divergence 10.3HR TimeframeETH Thus far has held up well at the Bullish Butterfly PCZ that I mentioned in the last idea I posted on ETH here: since then, I'v realized that this Butterfly PCZ aligns with the 0.886 retrace from the macro low to high and at these levels the price action has closely followed the initial projection marked in the gray with having an initial bounce followed by a secondary retrace back down to the lows. If this projection is to continue to playout we should expect to see ETH break free from this local zone and go for the more extreme highs.
In the process of making these lows it has developed a Bullish Gartley visible on slightly lower timeframes and the Gartley aligns with the macro 0.886 retrace and the Butterfly 1.902 HOP. I have decided to hide the butterfly on this chart post simply because I want to highlight the Gartley that has formed but you can see on the chart I referenced before that the Butterfly is also here.
On top of forming this Bullish Gartley, we can also see that there is a notable amount of Bullish Divergence on the MACD and RSI and that the ATR has come down fully from the pervious spike meaning that ETH from here has likely confirmed the low and will be set to make higher highs soon as all the timeframes are now aligned. I have much higher targets overall when looking at the daily chart pattern but if I were just to play this lower time frame gartley I would first target the line of best fit at around $3,390 from there we can look to see if we can hit the higher target presented in the higher timeframe idea.
#ZECUSDT - Another leg up is aheadWe all saw a massive bullish in zec in previous days out of 260% instant bullish... and now it's in consolidation
it shows a symmetrical triangle pattern in hourly chart with 2 attempts of breakout ... third one must be work
the next station at ( 250 - 280$)
best Regards:
Ceciliones🎯
BellRing Brands (BRBR) Weekly Gartley@ Key Levels + Kijun SignalIn March 2025, I previously took a look at this budding public company BellRing Brands, Inc. for a long-term investment horizon. It was priced around 74 at the time, then the fall of the overall market status put additional pressure on its stock, although the company itself is booming and meets my fundamental parameters. See the following:
Since then, we had an awesome and confident forward guidance from the company in the last earnings call in May 2025: bellring.com
Now, looking at BellRing Brands (BRBR) once again, on a weekly chart, key technical patterns have formed that look very promising and solid with its many confluences.
TECHNICALS:
WEEKLY:
Many weekly confluences have appeared from a technical perspective. Here is what I see:
(1) There is a clear Bullish Gartley-ish pattern in a weekly retracement to 50% followed by a retracement to 78.6% of a preceding move.
(2) The price is around 78% fib support.
(3) Horizontal area of support: The 50 - 58 area is a whole prior area of horizontal support that was a prior resistance area back in July 2024, and the price has landed back on that area. You know what we say as technicians and investors: past resistance = future support.
(4) MACD Hidden Bullish Divergence (weekly)
(5) The price tested the weekly cloud and broke through; however, bullish extremes were triggered when that happen, which is rare based on all my personal studies. In fact, the current level 55-58 marks the end of a bearish double top cycle that began around March 2025.
(6) A weekly Doji with volume support (classified as a "dVa" in my old notes of Volume Price Analysis).
Here is the weekly chart:
MONTHY:
BRBR is poised to rally Q3 and Q4 2025.
We have a potential monthly bounce of the kijun forthcoming along with good fundamentals going forward supporting the growth of the company in the long term.
** potential monthly Kijun Trend Bounce **
Here is the monthly chart:
Target:
Currently, the price is 58.54. My tentative target is around 140 by March 2026.
Thus, with all the fundamental support, good forward-looking guidance, and the technical I believe that BellRing Brands (BRBR) is at a great price right now. It is prime to continue its stretch of growth for 2025. Looking forward with investor foresight, the case for BellRing Brands and its stock (BRBR) is not only a high-probability outlook of positivity, but a high odds outcome of technical price pattern success. What a great discount.... :)
NEAR the Bottom? - The Crash Ends HereBack in October 2023, NEAR embarked on an incredible bull run lasting 147 days, surging from a low of $0.971 to a high of $9.01—an astounding +828% gain. Following this euphoric phase, the market sentiment shifted dramatically. Over the subsequent 392 days, NEAR retraced to around $2, marking a -78% decline. Now, with the market at a critical juncture, the question remains: when does the madness of the crash end, and can we finally see a reversal?
Harmonic Patterns & Fibonacci Confluence
Chart Pattern Analysis: The XABCD Framework
Using the XABCD pattern tool, we identify the following key points:
Point X: $0.971
Point A: $9.01
Point B: $3.076
Point C: $8.244
Point D: $1.978
Durations:
X-A: 147 Days
A-B: 143 Days
B-C: 122 Days
C-D: 126 Days
These durations show remarkable symmetry—with the up-move phases (X-A and A-B) nearly matching in time, and similarly for the correction phases (B-C and C-D). This time symmetry supports the presence of a harmonic structure, and the retracement levels help validate the potential for a reversal.
Fibonacci Implications
Fib Retracement of XA: Point B is at 0.738
Fib Retracement of AB: Point C sits at 0.871
Fib Retracement of BC: Point D lands at 0.875
Fib Extension of BC: Point D is at 1.212
While Point D’s retracement at 0.875 is slightly deeper than the classic 0.786 level expected for a Gartley Harmonic, it remains close enough to validate a harmonic correction, especially considering market noise. Additionally, the expansion of BC at 1.212 is close to the 1.27 range, lending further credence to this being a Gartley-type pattern.
Time Factor: Fibonacci Time Extensions & Exhaustion
147-day Bull Run: NEAR rose from $0.971 to $9.01 in 147 days.
392-day Bearish Correction: Since hitting $9.01, the price has retraced for 392 days.
Fibonacci Time Extensions:
1.618 multiplier: 147 × 1.618 ≈ 238 days. A Classic "golden ratio" reversal target. This period coincided with a +135% surge in November.
2.618 multiplier: 147 × 2.618 ≈ 385 days. High-probability exhaustion point. This is nearly equal to the current 392 days, suggesting that time-based exhaustion may be imminent.
The alignment of these time-based measures with the price retracement (approximately 87.5% retracement of the original move) signals a critical juncture where the bearish phase could soon be over.
Identifying the Support Zone & Long Opportunity
Based on harmonic and Fibonacci analyses, the confluence of key support levels points to a potential bottom:
Harmonic Point D: Trading near $2.
Monthly Level: $1.99 acts as a strong support benchmark.
Fibonacci Retracement (0.886): at $1.887.
These levels create a long opportunity window between $1.99 and $1.887. This confluence offers a solid entry region for long positions.
Additionally, other confluence factors include:
Fibonacci time extension at the 2.618 level (around 385 days) aligning with the current duration of the bearish phase.
The symmetry of the XABCD pattern adds to the reliability of the support structure.
High-Probability Trade Setup
Long Entry:
Entry Zone: Accumulate positions in the $1.99 to $1.887 range.
Target: Aim for the 0.5 Fibonacci retracement level of the bull run, approximately $5.00, which represents a potential +150% gain from current levels.
Risk-to-Reward (R:R): With the setup targeting a substantial rebound, the risk-reward ratio is very attractive, particularly if entry is taken in the defined confluence zone.
Market Outlook:
Current Sentiment: NEAR is in a significant downtrend, evidenced by a dramatic -78% retracement after an explosive bull run.
Reversal Indicators: The harmonic pattern, Fibonacci retracements, and time exhaustion (392 days approaching the 2.618 extension) all point towards a possible bottom formation in the coming month, particularly during April.
Potential Reversal: If NEAR holds within the $1.99 to $1.887 window, a reversal back towards $5.00 appears plausible, echoing the conditions seen at previous market cycle reversals.
Key Takeaways
Historic Run & Severe Correction: NEAR surged over +828% in 147 days only to retrace -78% over the following 392 days.
Harmonic Confluence: The XABCD pattern and Fibonacci levels create a compelling argument for a turnaround.
Time & Price Alignment: Fibonacci time extension around 385 days combined with an 87.5% price retracement suggests market exhaustion.
Solid Long Entry Zone: The support between $1.99 and $1.887 offers an attractive risk entry point with the potential to target a move back up to $5.00.
After decades in the trading arena, one thing is clear—the market often cycles through periods of euphoria and despair before turning a corner. NEAR's confluence of harmonic symmetry, Fibonacci retracement, and time-based exhaustion is almost too aligned to ignore. With a defined long entry window between $1.99 and $1.887, this might be the moment to consider a high-probability long trade. As always, manage your risk diligently and wait for clear confirmation.
Wrapping it up here, happy trading =)
If you found this helpful, leave a like and comment below! Got requests for the next technical analysis? Let me know.
EURUSD BUYEURUSD had a rejection from support level and we have witnessed a double bottom on support level and also seen HH and HL pattern on H4 to H1 time frame also another confluence for being bullish over this moment of time is we have seen a fibonachi retracement of bearish move completed with 68% of retracement we are bearish over the pair from higher TF prespective but bearish on lower ones
Comprehensive Analysis of the Gartley Harmonic PatternThe Gartley Harmonic Pattern, a cornerstone of harmonic trading, was first introduced by H.M. Gartley in his 1935 book "Profits in the Stock Market." This pattern leverages Fibonacci retracement levels and geometric price formations to identify potential market reversals, providing traders with a strategic edge.
__________________________The Bullish Gartley Pattern___________________
Structure:
X-A Leg: The initial upward movement.
A-B Leg: A retracement of approximately 61.8% of the X-A leg.
B-C Leg: An upward move retracing between 38.2% and 88.6% of the A-B leg.
C-D Leg: The final downward movement, retracing 78.6% of the X-A leg, marking the pattern completion at point D.
Entry Criteria:
Entry Point: Enter a long (buy) position at point D, where the price is expected to reverse upward. This is typically the 78.6% Fibonacci retracement level of the X-A leg.
Stop-Loss:
Placement: Set a stop-loss order slightly below point X to safeguard against unexpected price movements. This minimizes potential losses if the pattern fails.
Take Profit:
First Target: Place the initial take profit target at point B, the retracement level of the A-B leg.
Second Target: Set the second target at point C, the retracement of the B-C leg.
Extended Targets: For a portion of the position, consider holding to capture further gains if the price continues to rise.
_________________________The Bearish Gartley Pattern_____________________
Structure:
X-A Leg: The initial downward movement.
A-B Leg: A retracement of approximately 61.8% of the X-A leg.
B-C Leg: A downward move retracing between 38.2% and 88.6% of the A-B leg.
C-D Leg: The final upward movement, retracing 78.6% of the X-A leg, completing the pattern at point D.
Entry Criteria:
Entry Point: Enter a short (sell) position at point D, where the price is anticipated to reverse downward. This corresponds to the 78.6% Fibonacci retracement level of the X-A leg.
Stop-Loss:
Placement: Set a stop-loss order slightly above point X to limit potential losses if the pattern does not play out as expected.
Take Profit:
First Target: Place the initial take profit target at point B.
Second Target: Set the second target at point C.
Extended Targets: Consider holding a portion of the position for additional gains if the price continues to decline.
_________________________Key Considerations__________________________
Precision: Accurate measurement of Fibonacci levels is critical. Even slight deviations can invalidate the pattern.
Confirmation: Utilize additional technical indicators or price action signals to confirm the pattern before initiating a trade. This can include moving averages, trend lines, or oscillators.
Risk Management: Adhere to strict risk management practices. This includes setting appropriate stop-loss levels and managing position sizes to protect capital.
____________________________Conclusion______________________________
The Gartley Harmonic Pattern is a sophisticated and reliable tool for identifying potential market reversals. By mastering the intricacies of both the bullish and bearish Gartley patterns, traders can enhance their analytical capabilities and improve trading outcomes. Integrating these patterns with other technical analysis methods and maintaining rigorous risk management protocols is essential for consistent trading success.
Incorporating the Gartley pattern into your trading strategy involves practice and diligence. Ensure that you continuously refine your skills in identifying these patterns and executing trades accordingly, always mindful of market conditions and broader economic factors.
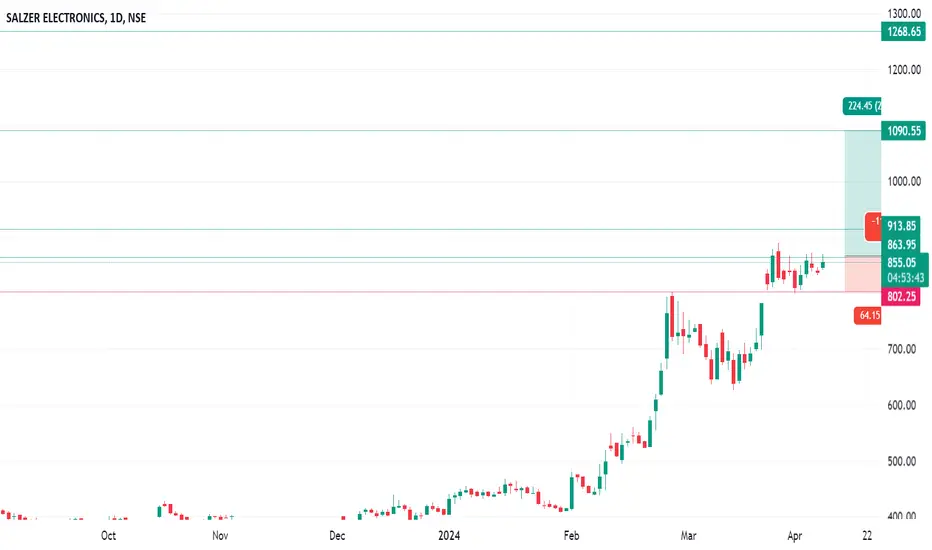
#SALZERELEC#SALZERELEC
SALZERELEC Good for Holding around 6 TO 9 Months ..... Current Price at 848.05......... Keep SL at 802. .... (On Closing Basis ... Means ... Daily Candle closed Below 802 )….. After Close Crossing 913 …. Trail SL to 913 Targets are Shown on Chart in Greens .
Patent
It has received a patent for ‘Integral Cam Operated Rotary Switches’ for a duration of 20 years, ending 2031. It has registered a Patent for Rotary Switches, five product patents in process.
Diversification into Smart Meter
In Feb,24, the company announced the establishment of a Smart Meter Manufacturing Business in Coimbatore with an annual production capacity of 4 million smart energy meters which will be increased to 10 million in Phase Two. The first batch of smart meters is expected to roll out in Q1 FY25.
Clientele
Valeo, Delta, Siemens, L&T, Schneider Electric, Nuclear Power Corporation, Kone, Indian Railways CED, ABB etc
Market Share
The Co is the largest manufacturer of Cam Operated Rotary Switches with 25% market share.
Promoter holding has increased by 2.08% over last quarter.
Long on EURJPY with CautionThis week, I'm taking a long position on EURJPY based on the 4-hourly chart. While some may see it as a Bullish Gartley pattern with a warning sign, others may interpret it differently, perhaps as a Bullish Gartley on PEZ or a key support level.
My Trade Plan on EURJPY
1. Long position initiated based on the 4-hourly chart.
2. Watching closely for any violation of 161.23, which could prompt a reevaluation.
3. Awaiting the market to hit the first target.
Share your thoughts and trade plans for EURJPY. How are you interpreting the pattern?
Let's continue the discussion!
Bullish Bias on GBPJPY1. Bullish Bias:
- I have a more bullish outlook on GBPJPY compared to GBPUSD.
- Clear violation of the Daily Chart on both GBPUSD and GBPJPY.
2. Trading Setup:
- A Type2 Bullish Gartley Pattern on GBPJPY is the key trading setup.
- Aiming to go long on GBPJPY.
Share your insights and trade plans for the week. What's catching your eye?
Let's discuss and navigate the markets together!
LUMN: Bullish Gartley Visible on the 3-Month ChartShares of Lumen Technologies are currently sitting at the HOP Level of a Massive Bullish Gartley that is visible on higher timeframes such as the Monthly and Quarterly Charts. It is also showing Bullish Divergence on the MACD and RSI and looks to be ready to make a move towards $6.00 in the short term, but the situation could evolve into a bigger long term move towards $25.00 and $50.00
VLCN: Bullish Gartley with Bullish Divergence at a Double BottomVolcon is potentially forming a Double Bottom with Bullish Divergence and is doing so at the potential HOP Level of a Bullish Gartley on the Hourly with Bullish RSI BAMM Confirmation. If this Gartley plays out we would expect a move towards $3.00 this move towards $3.00 could then lead to a Double Bottom breakout which would take the price up to around $7.00
VLong
BLUR---->Long (but What's Next Move?)Hello to all
Regarding the Todays Sharp movement, it seems that the general view of BINANCE:BLURUSDT.P is very bullish , but after such a movement, it is not out of mind to expect a correction of 20 to 50% at most .
In my personal opinion , the price in this trend will not have the necessary momentum to break and cross the $0.45 range , and the price correction will start after the price is rejected from the $0.45 area.
And it will continue until the price of 0.3$ and maybe even more intense up to the area of 0.2$ .
And after that, we can expect the start of the next price rally towards the points indicated in the chart, especially $0.55 and $0.9 .
My Personal setup :
Entry 0.3$ - 0.22$
TP 0.55$ - 0.77$ - 0.9$ - 1.2$
SL under 0.20$
Also, if the price breaks out from the yellow line, we will have a good position to enter and profit from higher targets:
Entry 0.45$
TP 0.9$ - 1.2$
SL Bullish Trend End Confirmations!
MOBILEUSDT: Bullish Gartley with Bullish DivergenceMOBILE appears to be Bullishly Diverging on both the MACD and RSI at the range lows aligning with the PCZ of a Bullish Gartley if it plays out I see it very likely that we push back up towards the highs and perhaps even the Fibonacci Extensions.
MLong
Intel: Bullish Gartley with Bullish Divergence Targeting $64.19Leading to the most recent earnings report, Intel had reached a 61.8% retrace from High to Low and was showing signs of reversing, so I decided to take profit on Intel. Now, upon spotting a potential trend continuation Bullish Gartley I now think it's possible for INTC to recover from here and perhaps go all the way for the 0.886 at $64.90, so I will be buying back in at these lower prices.
For context on the previous bullish setup, check the chart below:


