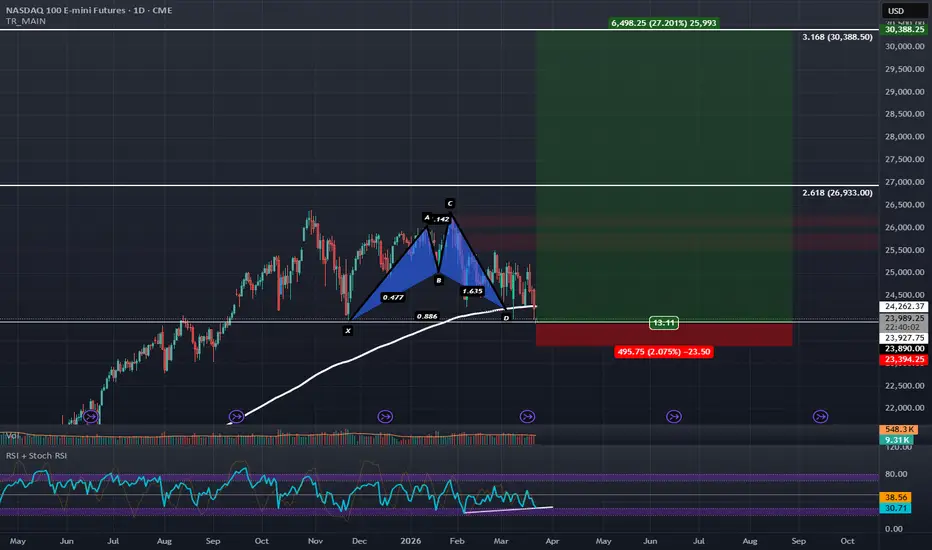
Nasdaq Futures is Holding Support for the Third TimeNasdaq Futures has been trading around the 200-day EMA and .886 PCZ of a Bullish Shark for awhile now kind of in line with what the S&P-500 Futures have been doing.
This level aligns with the August 2025 High and it seems to be diverging bullishly on the RSI here. Things should get more confident if we can trade back above the 200- day EMA just above the current price as we gap-down into support for the third time.
I think equities are likely to rally as Crude Oil futures come down signific
Bullish Shark
A Triangle Appears In Bloody WatersOANDA:EURGBP seems to have found itself Consolidated into a Rising Triangle with Higher Lows into Equal Highs.
Last time price was at these levels a Harmonic pattern, the Bullish Shark, formed and we seen price make quite a rise!
Now triangle patterns are statistically known to fail 1/3 of the time but with price forming a Rising Triangle, we must assume that price could very well be looking to head back up from such an area of Support.
If price is able to Close above the Resistance of the p
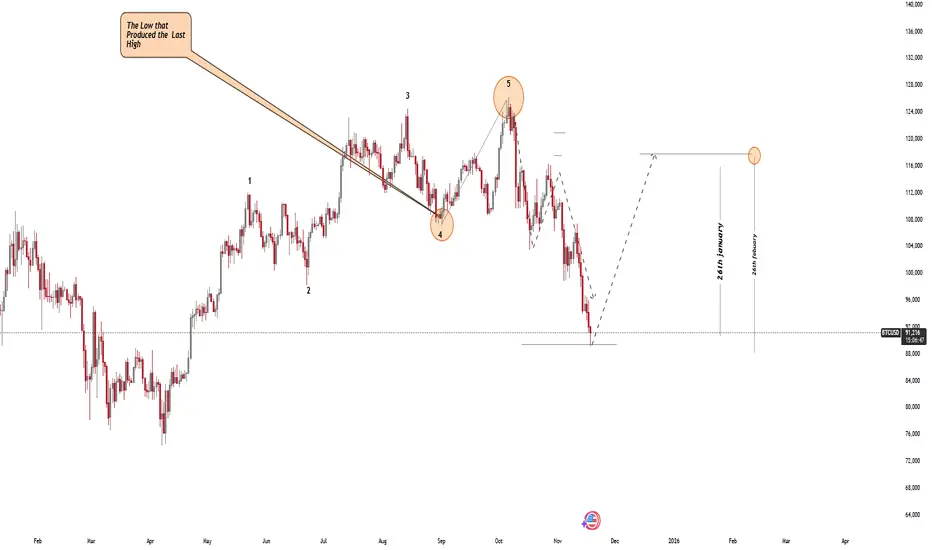
Potential BTCUSD RUsh to $155KPrice action has reached our anticipated support level of $89,000, a critical threshold we identified in our previous analysis.
Based on current technical structure, we are positioning for a potential rally toward $155,000 in the next 24weeks.
However, over the coming weeks, with our target window extending through January 26th.
Forward Outlook:
The manner in which price navigates to this level will be instrumental in shaping our 2025 outlook. We are monitoring two primary scenarios:
Bullish C
Ethereum (ETH/USD) Bullish Breakout – Eyes on $2,500+ Target 📈 Chart Overview:
Timeframe: 4H (Ethereum/USDT)
Trend Reversal: Ethereum has broken out of a falling wedge pattern, indicating a shift from bearish to bullish momentum.
Support Level: Around $1,800 - $1,900, where price previously found strong buying interest.
Retest Confirmation: ETH successfully retested the breakout level (~$2,020), confirming a potential bullish continuation.
Resistance Zone: The next key resistance area is around $2,250, followed by a potential move towards the $2,530
XAUUSD BULLISH PATTERN CHARTHEY,
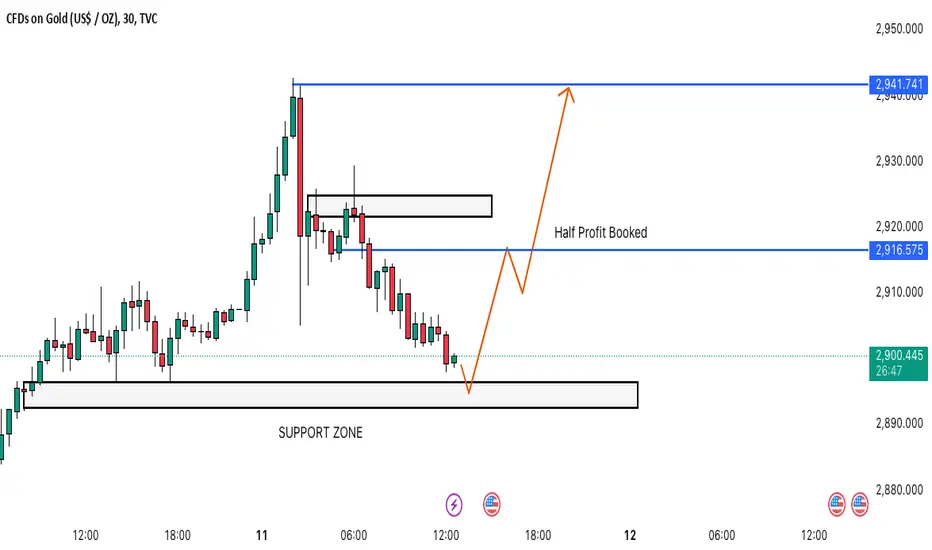
all my trader friends if you see m30 there is strong support at 2895 to 2899 so posible to gold fall and retest the area of this level and pull back to 2915.
if powell speaks is good for currency that time so we see gold fall wanna gold again buy from 2895.
BUY scenerio target 2916 this position all trader booked their 50% profit and half for continue to 2940
Bullish Shark Pattern on NZDUSD M15 ChartI love trading sideways consolidation breakout trades, but since I missed the initial move, I've been patiently waiting for a retest. Now, an even better opportunity has presented itself!
What's Happening?
- Bullish Shark Pattern : A Bullish Shark Pattern is forming on the M15 (15-minute) chart at 0.6046 on the NZDUSD.
Why is this Exciting?
- Combo Trade Management : This setup allows for a combination of strategies that can significantly reduce initial risk while increasing potential
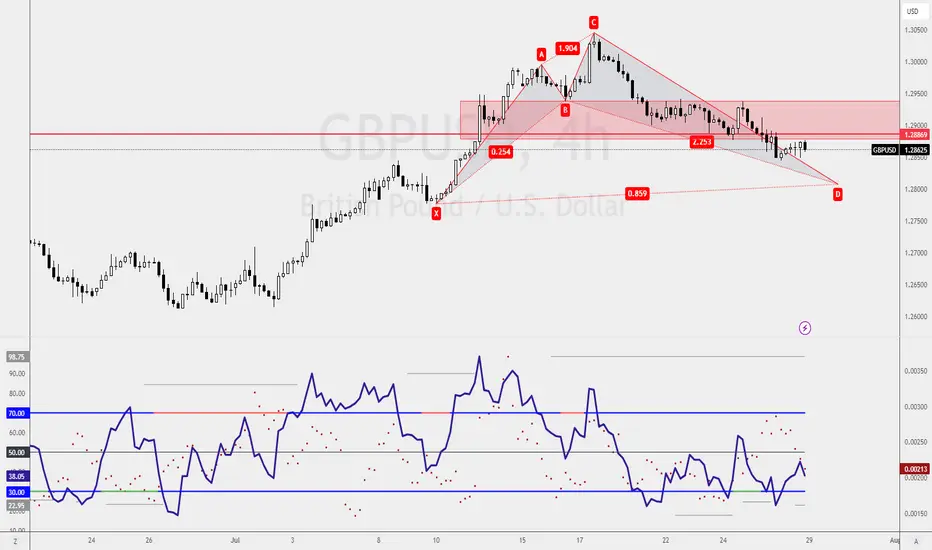
Buying Opportunity on GBPUSDIf you're looking for a buying opportunity on GBPUSD like I am, there’s an exciting setup to keep an eye on.
Current Overview:
4-Hourly Chart:
- There’s a Bullish Shark Pattern nearing completion, which is a great setup for a potential buy.
Buying Opportunity:
Bullish Shark Pattern Completion:
- Key Level: 1.2807
- What to Do: Wait for the Bullish Shark Pattern to complete at 1.2807.
Strategy:
1. Magic Candle Confirmation: This is crucial! Wait for the Magic Candle Confirmation at 1.2807 befo
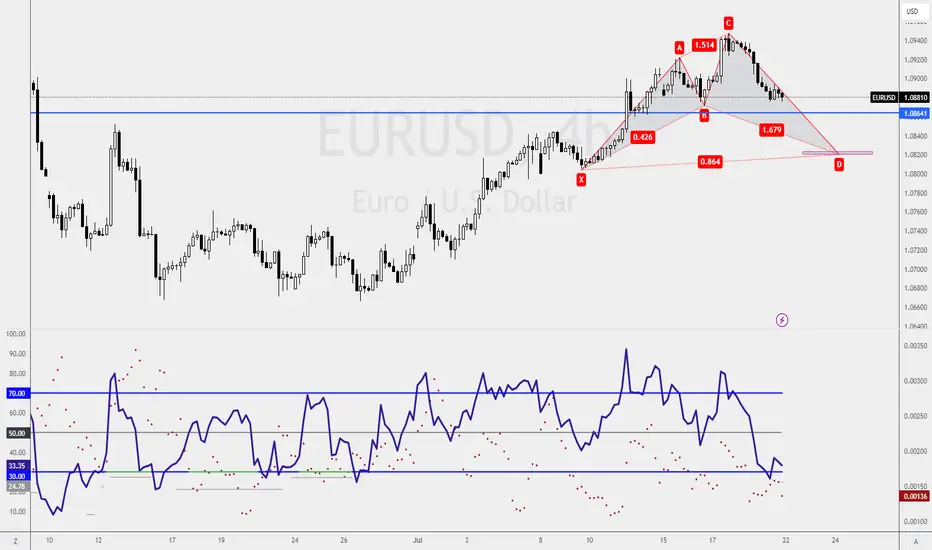
Buying Opportunities on EURUSDHere’s an exciting update on EURUSD, which has just broken out of consolidation on the weekly chart. Let’s explore the buying opportunities available.
Weekly Chart:
EURUSD has broken and closed above the consolidation, signaling a potential upward trend.
Buying Opportunities on the 4-Hourly Chart:
1. Support Level:
- Key Level: 1.0843
- What to Do: Look for a buying opportunity at this support level.
2. Bullish Shark Pattern:
- Pattern Completion Level: 1.0820
- What to Do: Wa
GBPUSD Breakout and Bullish Shark Pattern!I hope you’re all doing well and staying sharp in the markets. I wanted to share an interesting setup I’ve been eyeing on GBPUSD that could be a great opportunity for both new and experienced traders alike.
What’s Happening?
- Weekly Chart:
- GBPUSD has finally broken out from its sideways consolidation, which is super exciting! This breakout could mean we’re in for some upward action.
The Plan:
On the 1-hourly chart, I’ve spotted a Bullish Shark Pattern. This pattern is a fantastic tool f
Long Opportunities on EURUSDIf you are looking to long EURUSD just like me, the 4-hourly chart presents a promising Bullish Shark buying opportunity. Here's how we can approach it:
Bullish Shark Pattern:
- Pattern Completion Level: 1.0820
- Strategy: Wait for a Magic Candle Confirmation at 1.0820 before entering a long position.
- Stop-Loss: Place a stop-loss just below the pattern completion level.
Support and Resistance Level:
- Support Level: 1.0864
- Strategy: Look for a buying opportunity at this support level.
Classic Support and Resistance with Harmonic Pattern on USDCADUSDCAD has a classic support and resistance line on the 1-hourly chart. Here are two approaches depending on your trading style.
Classic Support and Resistance Levels:
Shorting Opportunity:
- Resistance Level: 1.3691
- Strategy: Look for a shorting opportunity at this resistance level.
- Stop-Loss: Place a stop-loss just above the resistance.
- Target: Aim for the support level at 1.3641 or below.
Buying Opportunity:
- Support Level: 1.3641
- Strategy: Look for a buying opportunity at th
Trading Idea: Counter-Trend Trading Opportunities on EURUSDEURUSD has an overall bearish trend. At this point, many counter-trend traders, including myself, are looking for counter-trend trading opportunities. We've had some luck in this regard.
Analysis:
Daily Chart:
- Bullish Shark Pattern: Confirmation is formed, suggesting potential for a counter-trend move.
4-Hourly Chart:
- Falling Wedge Trading Setup: Provides a setup to go long and take advantage of the bullish pattern on the daily chart.
Strategy:
- Bullish Shark Pattern: Use this co
AUDCAD Analysis: Focus on Bullish Shark PatternIf you're looking at AUDCAD, the 4-hourly chart setup might seem tempting for a buying opportunity. However, I prefer the 1-hourly chart, specifically the Bullish Shark Pattern.
1-Hourly Chart:
- Key Level : Ensure an MCC appears at 0.9041 before entering a buying opportunity.
What's your trade plan for AUDCAD? Comment down below and share your thoughts!
Happy trading!
GBPUSD Analysis: Trend Continuation TradingTrade Strategy: Trend Continuation
- Key Level (1-hourly chart): Retest at 1.2419
- Additional Setup (4-hourly chart): Bullish Shark Pattern at 1.2141
Analysis:
- Approach: Identifies potential opportunities for trend continuation trading
- Key Level: Looks for a retest at 1.2419 on the 1-hourly chart as an entry point
- Additional Setup: Considers stretching the target to 1.2141, the completion of a Bullish Shark Pattern on the 4-hourly chart
Trade Plan:
- Entry Point (1-hourl
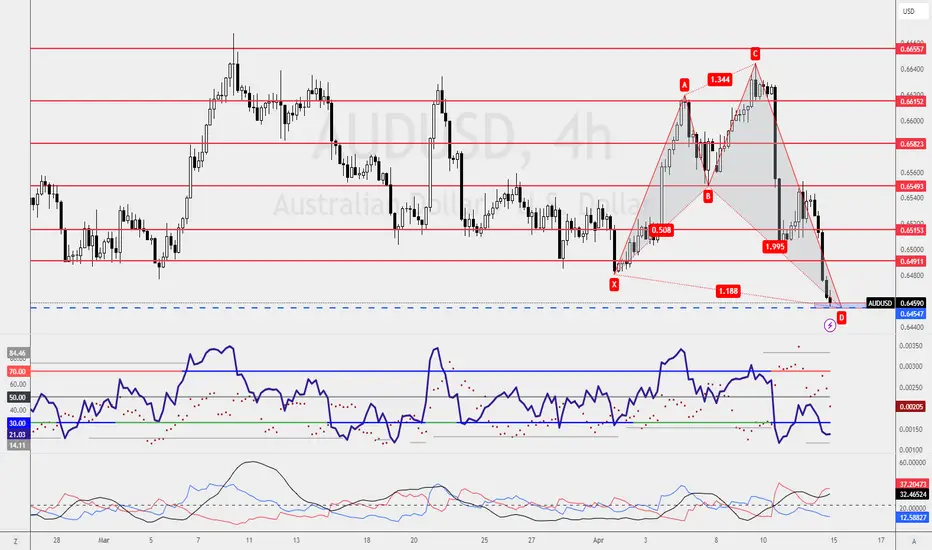
AUDUSD Analysis: Bullish Shark Pattern- Trade Strategy: Bullish Shark Pattern
- Key Level: 0.6454 (Retest Level)
- Challenge: Strong Bearish Movement
Analysis:
- Importance: Highlights the difficulty of trading a Bullish Shark Pattern amid strong bearish pressure
- Technical Analysis: Identifies a Bullish Shark Pattern on the AUDUSD chart
- Challenge: Requires a 3-bar reversal and candlestick confirmation for a viable buying opportunity
Trade Plan:
- Entry: Consider a conservative entry at the retest level of 0.6454
- Con
NZDJPY Analysis: Bullish Combo Trade SetupTrade Strategy: Combo Trade (Bullish Deep Gartley + Bullish Shark)
Key Levels:
- Bullish Deep Gartley Pattern: 4-hourly chart
- Bullish Shark Pattern: 1-hourly chart
- Trading Zone: Coincides with Bullish Shark completion
Analysis:
- Importance: Utilizes a combo trade strategy for enhanced risk management and profit potential
- Technical Analysis: Identifies a Bullish Deep Gartley Pattern on the 4-hourly chart and a Bullish Shark Pattern on the 1-hourly chart
- Trade Management: Enables a
GBPUSD Analysis: Support and Resistance Trade SetupTrade Strategy: Support and Resistance
Key Levels:
- Support at 1.2435 (1-hourly chart)
- Resistance at 1.2534 (1-hourly chart)
Analysis:
- Importance: Utilizes support and resistance levels for trading opportunities
Trade Plan:
- Buying Opportunity: Look for buy entries near support at 1.2435
- Shorting Opportunity: Consider shorting near resistance at 1.2534
Insights:
GBPUSD presents support and resistance trading opportunities on the 1-hourly chart. Traders can consider buying n
BOIL: Set for a Potential Bullish Reversal at Bullish Shark PCZNatural Gas on an intra-week basis seems to be in a position to Bullishly Reverse as it sits at the PCZ of a potential Bullish Shark with slight Bullish Divergence near the previous month's low. My target will be anywhere between $16 and $20 though it could always go higher.
Anticipating a Buying Opportunity on Daily ChartEURUSD is catching my attention, and here's my perspective:
1. Bearish Shark Pattern on Daily Chart:
- For traders seeking shorting opportunities, there's a Bearish Shark Pattern on the Daily chart.
- The completion of this pattern might indicate a potential bearish move.
2. Buying Opportunity at 1.0879:
- Personally, I'm eyeing a buying opportunity on EURUSD.
- Despite a flawed Bullish Shark Pattern, I'm looking to enter long at 1.0879.
Share your thoughts and trade plans for EURUSD in t
EURUSD Type2 Bullish Shark Pattern - Two-Trade StrategyI'm pleased to share an update on the EURUSD Type2 Bullish Shark Pattern trade. If you've been following my TradingView post, you might have already profited from the first target, and now we're looking at a potential second target.
Here's the current strategy:
- First Target : Already Profited
- Second Target: Awaiting Fulfillment
In the event of a retracement to 1.0815, I am considering engaging in an additional long position.
This strategy involves a Double Bottom retest trade. Essent