Diagonal C&H?NVIDIA (NVDA): Cup & Handle Breakout Setup
NVDA appears to be completing a multi-month cup-and-handle pattern , with the November 2025 peak near $200 forming the left rim and the March 2026 low near $165 marking the bottom of the cup.
The subsequent recovery has brought price back toward the $235 neckline , while the pullback into the $195–$200 area formed a potential handle. NVDA is now pushing back toward the neckline, setting up a potential breakout if price can clear and hold above ~$23
Cup And Handle
ORCL - Resistance Retest and Small Cup Setup💡 Swing setup idea
Resistance retest / small cup breakout
🔎 Analysis summary:
The price just came back to resistance after crossing above the 50 SMA. We can also see a small cup closing, which makes this setup worth watching.
👀 Levels to watch:
Entry trigger: Break above $77.60
Target: $96.05
Stop: Under the breakout level
💬 Will the price break through this area? Let me know in the comments! 👇
Good luck!
⚠️ Note: This is for educational purposes only and is not financial advice.
YETI – Cup & Handle Breakout Retest: The Story ContinuesPresenting another high-probability chart story.
YETI has quietly completed one of the most reliable bullish continuation patterns in technical analysis — a Cup & Handle.
After forming a rounded base over several months, price successfully broke above the neckline around $51, confirming the pattern. Instead of chasing higher immediately, the market is doing exactly what strong breakouts often do...
It's retesting the breakout level.
So far, the neckline has transitioned from resistance into
Potential cup and holder forming.Target $1,600There's a potential cup and handle pattern is forming on the chart. The official confirmation can be only after rejecting the resistance zone at 1200, forming a handle, and braking through the resistance with a target of 1600.
But if you are ready to hold the position over 2-3 months, it might be a great entry point.
Target #1 $1,200
TRget #2 $1,600
DRAM potential Cup and handle pattern - early entry. Target 110There's a potential cup and handle pattern is forming on the chart. The official confirmation can be only after rejecting the resistance zone at 80, forming a handle, and braking through the resistance with a target of 110.
But if you are ready to hold the position over 2-3 months, it might be a great entry point.
LYB - Resistance Retest and Cup & Handle Setup💡 Swing setup idea
Resistance retest / cup and handle breakout
🔎 Analysis summary:
The price just crossed above the 50 SMA and is now reaching resistance. We can also see a small cup and handle closing, which makes this setup worth watching.
👀 Levels to watch:
Entry trigger: Break above $64.90
Target: $77.90
Stop: Under the breakout level
💬 Will the price break through this area? Let me know in the comments! 👇
Good luck!
⚠️ Note: This is for educational purposes only and is not fi
CHFJPY: Bullish Outlook Explained 🇨🇭🇯🇵
I think that CHFJPY will likely continue rising after a retest of a recently broken daily horizontal resistance that turned into a potentially strong support after a breakout.
Expect a bullish continuation to 197.5
❤️Please, support my work with like, thank you!❤️
I am part of Trade Nation's Influencer program and receive a monthly fee for using their TradingView charts in my analysis.
MarketBreakdown | US30, NZDUSD, GOLD, AUDCHF
Here are the updates & outlook for multiple instruments in my watch list.
1️⃣ #US30 #DOW JONES daily time frame
After the last extended bullish movement, the market momentum declined heavily.
The price formed a bearish engulfing candle and an inverted cup & handle pattern then.
The price is currently stuck on a minor daily support.
Its breakout and a candle close below will trigger a corrective movement.
2️⃣ #NZDUSD daily time frame 🇺🇸🇳🇿
The market is a deep consolidation.
The price
ITA - 150 SMA Method and Cup & Handle Setup💡 Swing setup idea
Longer-term breakout setup / 150 SMA method
🔎 Analysis summary:
The aerospace & defense ETF touched the 150 SMA and moved higher from there. We can also see a big cup and handle closing, which puts this longer-term setup in an interesting spot.
👀 Levels to watch:
Entry trigger: Break above $250.80
Target: $289.80
Stop: Under the breakout level
💬 Will the ETF break out and continue the longer-term move? Let me know in the comments! 👇
Good luck!
⚠️ Note: This is f
USDJPY: Recovery Continues 🇺🇸🇯🇵
USDJPY formed a cup & handle pattern on a daily time frame.
A bullish breakout of its horizontal neckline indicates a strong buying sentiment.
With a high probability, the pair will rise further and reach 160.45 level soon.
❤️Please, support my work with like, thank you!❤️
I am part of Trade Nation's Influencer program and receive a monthly fee for using their TradingView charts in my analysis.
SARO - Resistance Retest and Cup & Handle Setup💡 Swing setup idea
Resistance retest / cup and handle breakout
🔎 Analysis summary:
The price touched the 50 SMA and moved back to resistance. We can also see a cup and handle pattern closing, which puts this setup in an interesting spot.
👀 Levels to watch:
Entry trigger: Break above $31.25
Target: $38.64
Stop: Under the breakout level
💬 Will the price break through this area? Let me know in the comments! 👇
Good luck!
⚠️ Note: This is for educational purposes only and is not financ
MCHP: Massive Cup & Handle Formation Nearing BreakoutEarnings Could Be the Catalyst 🚀
Microchip Technology has been building a multi-year Cup & Handle pattern on the weekly chart. After completing the cup below the trendline resistance, the stock is now forming a tight, downward-sloping handle, often the final consolidation before a potential impulsive move.
The handle is narrowing, volatility is contracting, and price is approaching the key breakout level. A sustained move above $104 would confirm the pattern and open the door for the measured
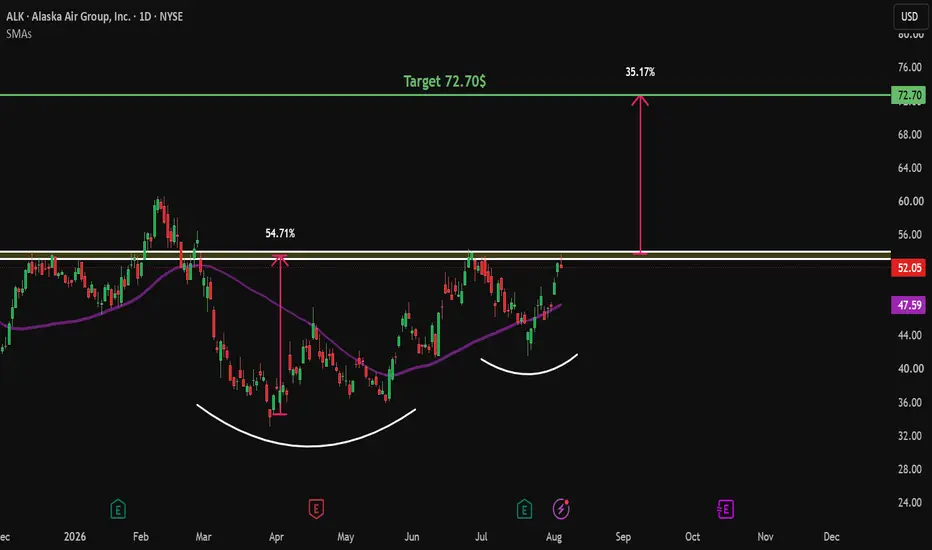
ALK - Resistance Retest and Cup & Handle Setup💡 Swing setup idea
Resistance retest / cup and handle breakout
🔎 Analysis summary:
The price touched the 50 SMA and came back to resistance. We can also see a cup and handle pattern closing, which puts this setup in an interesting spot.
👀 Levels to watch:
Entry trigger: Break above $54.00
Target: $72.70
Stop: Under the breakout level
💬 Will the price break through this area? Let me know in the comments! 👇
Good luck!
⚠️ Note: This is for educational purposes only and is not financi
CRGY - Resistance Retest and Cup & Handle Setup💡 Swing setup idea
Resistance retest / cup and handle breakout
🔎 Analysis summary:
The price is getting back to resistance and has just crossed the 50 SMA. We can also see a small cup and handle pattern closing, which makes this setup worth watching.
👀 Levels to watch:
Entry trigger: Break above $11.80
Target: $14.20
Stop: Under the breakout level
💬 Will the price break through this area? Let me know in the comments! 👇
Good luck!
⚠️ Note: This is for educational purposes only and
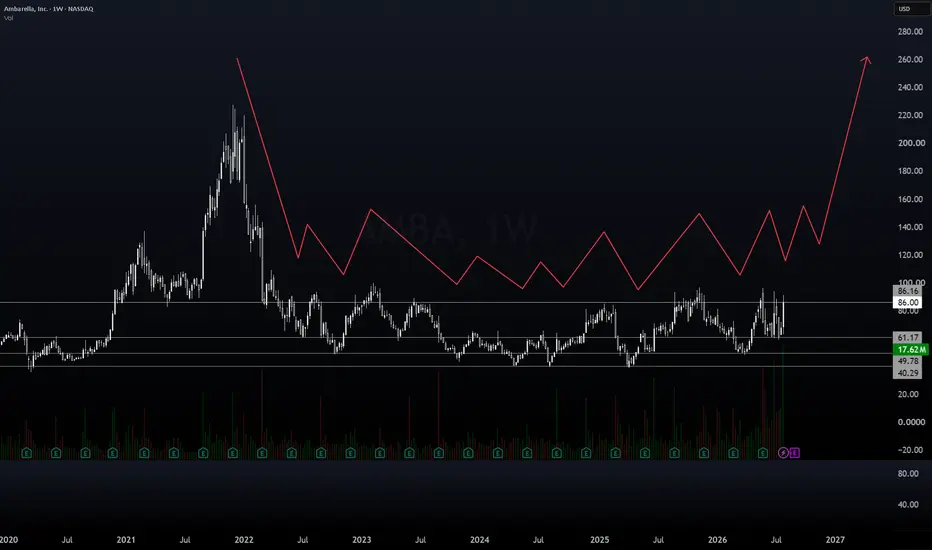
[Swingtrading] AMBA Longterm set upAMBA is currently moving sideways; I suggest exiting now and buying back in at 71.
- 71 (50-week SMA).
- Historically, it might break out from here and retest the 50-week SMA. If it drops further, just hold—since it's in a sideways pattern, it will likely return to the 80 range eventually.
- Consider buying a small position to hold; this could be the formation of a bottom.
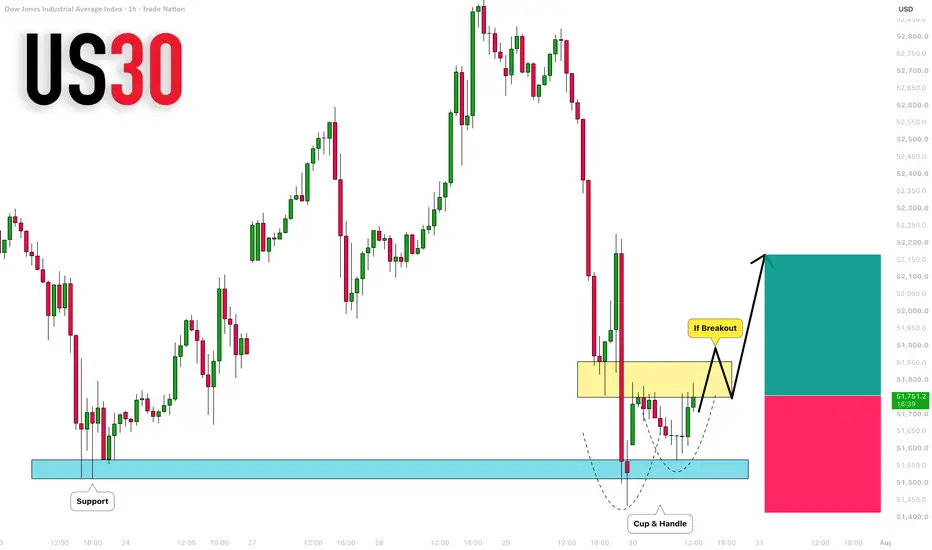
DOW JONES INDEX (US30): Potential Buying Opportunity Explained
I think that US30 may pull back from a key horizontal support cluster.
Your strong bullish confirmation will be a breakout and an hourly candle
close above a horizontal neckline of a cup & handle pattern on an hourly time frame.
An hourly candle close above 51,855 will confirm a violation.
A bullish continuation will be expected to 52,165 then.
❤️Please, support my work with like, thank you!❤️
I am part of Trade Nation's Influencer program and receive a monthly fee for using their Trad
GRND - 50 SMA Bounce and Big Cup & Handle💡 Swing setup idea
50 SMA support bounce
🔎 Analysis summary:
The stock is rising from the 50 SMA and looks to be closing a large cup and handle pattern. Buyers volume is also starting to pick up, but keep in mind the upcoming earnings report could add volatility.
👀 Levels to watch:
Entry trigger: Break above $16.55
Target: $22.99
Stop: Under the breakout level
💬 What do you think about this setup? Let me know in the comments! 👇
Good luck!
⚠️ Note: This is for educational purposes
GEN - 50 SMA Bounce and Big Cup & Handle💡 Swing setup idea
Big cup and handle pattern
🔎 Analysis summary:
The stock is bouncing off the 50 SMA and is closing a large cup and handle pattern. Buyers volume is also starting to warm up, which adds support to the setup.
👀 Levels to watch:
Entry trigger: Break above $28.15
Target: $38.17
Stop: Under the breakout level
💬 What do you think about this setup? Let me know in the comments! 👇
Good luck!
⚠️ Note: This is for educational purposes only and is not financial advice.
ETHUSD - Higher Lows & Double Bottom💡 Swing setup idea
Cup and handle continuation
🔎 Analysis summary:
After closing a double bottom, ETH is now starting to print higher lows. We can also see the chart shaping into a cup and handle-style continuation, which keeps the setup constructive.
👀 Levels to watch:
Entry trigger: Break above $1,964
Target: $2,402.55
Stop: Under the support level
💬 What do you think about ETH here? Let me know in the comments! 👇
Good luck!
⚠️ Note: This is for educational purposes only and is
HOOD has to hold the line hereWe looked at this one before when it finally broke out on June 15, but the trade was to be patient with this one. It was a nice cup and handle breakout, but has struggled since then as the market grinds at the index level and investors/traders are stepping off the gas a bit. It’s now back testing that breakout level so it’s back on my radar.
Fintech has been a steady leader for the last 4 weeks, and HOOD is a major player in fintech.
Crypto is also beginning to show relative strength in
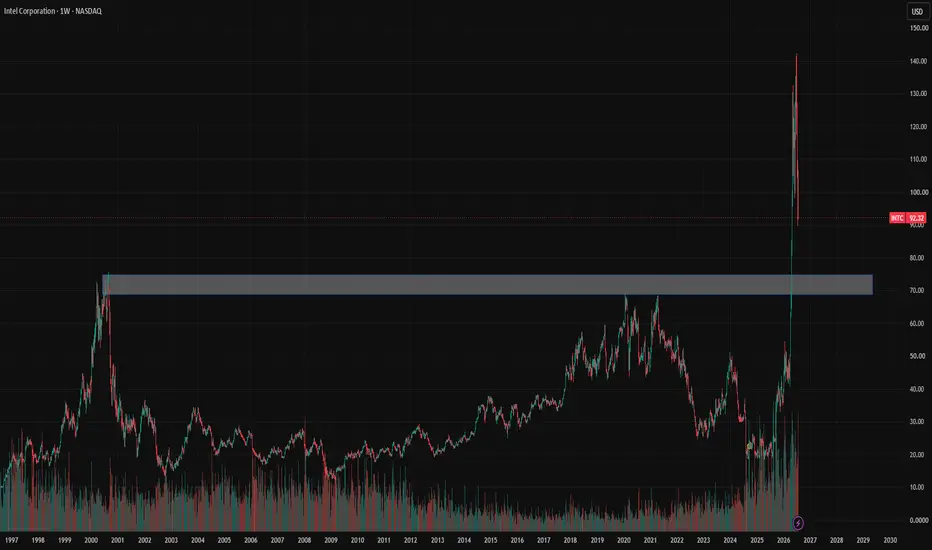
INTC — A 25-Year Ceiling Cleared, and the Retest That Decides ItBias: Long, but only on a retest. No position at 92.
Entry trigger Weekly reversal candle off 70–74 with above-average volume
Invalidation Weekly close below 68
Target 1 100–107 (reclaim the broken shelf)
Target 2 120
Risk per unit ~8% from entry to stop — size accordingly
Timeframe Weeks to months; this is not a next-week trade
Do nothing if: price stays between 74 and 107. That's the middle of the range and the worst place to commit.
Abandon the idea if: 68 goes on a weekly close. That put