HOW-TO: Grid in TradingViewZenAlgo - Grid is an overlay tool designed to map a structured Fibonacci execution framework directly onto price. Instead of using a fixed manual fib drawing every time, the script can anchor itself automatically from detected swing structure or use manually selected start and end points.
The purpose of Grid is to turn a price swing into a practical reaction map. It highlights key retracement areas, the Golden Pocket, entry and take-profit levels, and an extension target zone, while keeping the whole framework visually tied to current chart structure.
How to read Grid
At its core, Grid builds a directional range between two anchor points and projects a Fibonacci-based map from that range.
- The main anchor line defines the active swing leg.
- The retracement levels create the internal reaction grid.
- ENTRY and TP levels help organize the move into practical zones.
- The 0.618 to 0.65 area highlights the Golden Pocket.
- The 1.272 to 1.618 area marks the extension target zone.
- Manual anchors allow precise control, while auto anchors adapt to detected market structure.
This makes Grid useful not just as a drawing tool, but as a structured way to read pullbacks, continuation zones, and projected targets on live price action.
How Grid is built
The script can work in two modes.
- In manual mode, the range is anchored from user-defined start and end times.
- In automatic mode, the script uses swing structure and pivot logic to determine the active move.
- The anchor direction determines whether the grid is projected as bullish or bearish.
- The line color reflects that directional bias.
This means the indicator is always trying to map the currently relevant swing rather than forcing the user to redraw levels from scratch every time.
Main levels inside the Grid
Grid uses a custom retracement ladder built around practical trading zones.
- 0.146 is labeled as ENTRY.
- 0.236, 0.382, 0.5, 0.618, 0.786, and 1.0 act as progression levels and targets.
- The 0.618 to 0.65 area is highlighted as the Golden Pocket.
- The 1.272 to 1.618 area is highlighted as the extension target zone.
This gives the user both a reaction framework and a continuation framework in the same layout.
Why this matters
Many traders draw fibs manually, but the practical problem is usually not the drawing itself. The real problem is consistency: identifying the correct swing, keeping the map structured, and using the same logic across different market conditions.
Grid helps solve that by turning one active move into a repeatable execution map. Instead of focusing on random price reactions, it helps organize the chart into pullback zones, continuation areas, and projected extension targets.
Example scenarios
The real value of Grid appears when the levels are read as a map, not as isolated lines. A single fib level alone is rarely enough. What matters is how price reacts inside the structure, whether the move respects the active swing, and whether the reaction happens inside a meaningful zone such as ENTRY, Golden Pocket, or the extension box.
Bullish continuation from the ENTRY zone
In this scenario, price pulls back into the early retracement area after an upward swing has already been established. Rather than treating the retrace as random weakness, Grid frames it as a structured return into the active range.
If price stabilizes around ENTRY or the nearby retracement levels and starts to hold the bullish swing structure, the move can be read as continuation rather than reversal. This is where Grid helps separate a healthy pullback from a true breakdown.
Deep pullback into the Golden Pocket
This is one of the clearest use cases for Grid. Price retraces deeper into the 0.618 to 0.65 zone, which is highlighted directly on the chart. Instead of guessing where the most meaningful reaction area might be, the user already has a clearly defined pocket for deeper pullback behavior.
If price responds constructively inside that box, the Golden Pocket becomes a high-interest area for continuation monitoring. The value here is not prediction by itself, but the ability to focus attention where reaction quality matters most.
Bearish continuation after failed reclaim
Grid works the same way in reverse. In a bearish swing, price may attempt a recovery back into the retracement ladder, but fail to reclaim the upper levels with strength. In that case, the grid acts as a map of resistance rather than support.
This makes it easier to interpret whether a bounce is actually rebuilding strength or simply retracing into a structured sell-side zone before continuation lower.
Expansion into the 1.272–1.618 target zone
Once price confirms continuation, Grid does not stop at the retracement map. The 1.272 to 1.618 area projects a forward extension zone, which helps frame what a fully developed move could look like.
This is especially useful after the market has already respected the internal retracement structure. At that point, the extension box gives the chart a clean continuation objective without requiring a separate projection tool.
Structure context
Behind the grid, the script also contains pivot-based structure logic. It tracks internal and external swings and can label break / change-style events when enabled. In automatic mode, this structure contributes to how the active move is selected and how the main anchor line is maintained.
That matters because Grid is not just drawing random fibs from arbitrary highs and lows. It is trying to tie the fib map to an actual structural move on the chart.
How to best use it
Grid works best as a structured charting and execution aid rather than a standalone reason to trade.
- Use it to frame pullbacks inside an active swing.
- Watch how price behaves at ENTRY, mid-level retracements, and the Golden Pocket.
- Use the extension box to map where continuation could reasonably expand.
- Switch to manual anchors when you want full control over the measured move.
- Combine the grid with market structure, VWAP, volume profile, or higher timeframe levels.
Summary
ZenAlgo - Grid is designed to convert a live market swing into a practical execution map. By combining automatic or manual anchoring, retracement levels, Golden Pocket highlighting, and forward target projection, it helps the user read where price is pulling back, where continuation may develop, and where extension objectives begin to matter.  Education
GOLD - A countertrend correction in an uncertain market ICMARKETS:XAUUSD is testing the 4,600 level as part of a counter-trend correction; however, a short squeeze is bringing the market back to its senses. The market may test 4,500...
For traders, a negative backdrop is created by the numerous market manipulations carried out by both Trump and his opponents. Trump’s sharp statement at the start of the week ended in a retraction. However, rumors of possible negotiations are emerging. The market is reacting extremely sharply...
Risk appetite has returned: the dollar and yields are falling, oil is getting cheaper, giving gold a breather.
Holding factors: The details of the negotiations are unclear; there are no guarantees of progress.
The Pentagon is preparing to deploy thousands of troops from the elite 82nd Division to the Middle East.
The technical picture on the daily chart remains bearish. I expect a bounce from 4575 (4600) to retest 4500, where there may be a battle between market participants. A close below 4500 could lead to a decline to 4400
Resistance levels: 4575, 4600
Support levels: 4502, 4401, 4350
Overall, despite the pullback, the market looks weak, and I consider bullish sentiment premature. A short squeeze in the 4575–4600 resistance zone could trigger a sell-off toward 4500. 4500 is an important psychological level; a close below this support could trigger a continuation of the decline.
Best regards, R. Linda!  Short
Short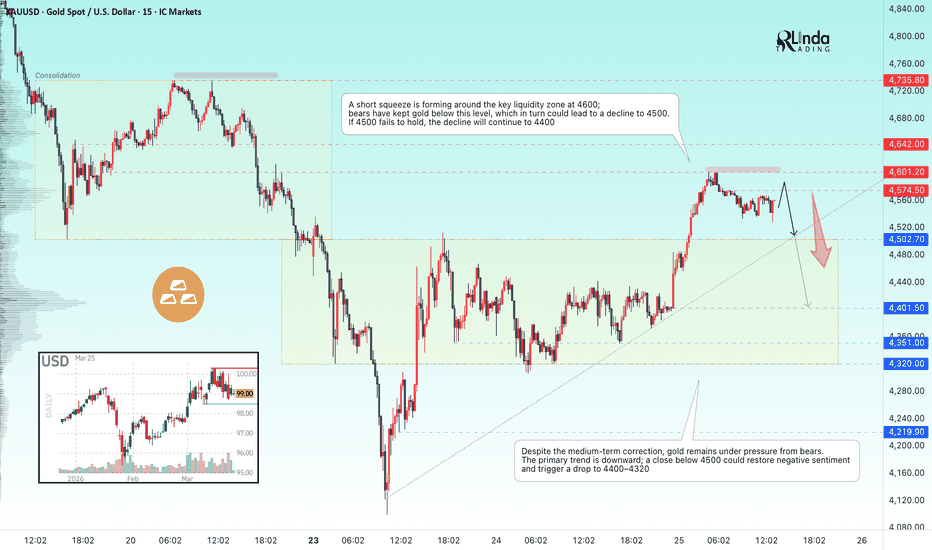
GOLD - A correction ahead of a potential declineICMARKETS:XAUUSD is correcting from yesterday’s euphoria over a possible de-escalation. But that was merely manipulation. The market may form a short squeeze before a decline
A dubious ceasefire (manipulation of the situation): Trump announced “productive talks” and a possible 5-day pause in attacks. Iran’s Foreign Ministry denied any contact with the U.S. during the war.
Gold and oil prices made sharp reversals, recouping some of their losses, but then came back under pressure.
Return to risk-off: Oil resumed its rise on expectations of “high prices for the long term.”
Fed rates: Inflation risks due to high oil prices are reviving hopes for a Fed rate hike.
Gold has entered a new reality: the escalation of the war no longer automatically pushes it higher, as markets are focusing on Fed rates rather than geopolitics per se.
Gold is under pressure from a downtrend, a strong dollar, oil, and high inflation...
Resistance levels: 4448, 4502, 4578
Support levels: 4320, 4219
The hunt for liquidity and a short squeeze could trigger a reversal and a decline within the main bearish trend.
Sincerely, R. Linda! Short 
HYPEUSDT - Consolidation above key support$BINANCE:HYPEUSD.P has been in a bullish trend since late January, indicating the presence of interested buyers in this altcoin. As part of a correction, the price is retesting the 37.0 support level, but at the same time, it is poised for an uptrend
Bitcoin is under pressure from a downtrend but is forming a rebound from 67K, thereby supporting the altcoin market. HYPE looks strong compared to other altcoins, maintaining a local trend over the past few weeks.
HYPE is testing trend support, forming an intermediate bottom and a rebound. If the bulls keep the asset above 36.7–38.3, the price may find support for further growth toward 43.75
Resistance levels: 40.5, 43.75
Support levels: 38.35, 36.77, 35. 88
Consolidation above the key support zone will confirm the bullish market’s intentions. The medium-term outlook is favorable, and growth could be directed toward 43.75–50.0
Best regards, R. Linda!  Long
Long
 Long
Long
GOLD - Correction before the fallICMARKETS:XAUUSD continues its plunge: down 8% on Monday, extending its decline of more than 10% from the previous week. Sellers face little resistance as the dollar and oil strengthen amid the escalating conflict in Iran
The dollar dominates as the primary safe-haven asset. Oil continues to rise due to the escalating situation. Gold’s appeal is waning.
The escalation of the conflict heightens risks of energy disruptions and inflation → markets are pricing in rate hikes → yields are rising → gold is under pressure.
If the tit-for-tat continues, a broad market sell-off will begin, and gold will be sold to cover losses on other assets.
Gold is caught in a trap: the geopolitics that should be supporting it are now working against the asset, strengthening the dollar and expectations of rate hikes. As long as the “war for the strait” continues, the dollar and oil remain the main beneficiaries. A rebound is possible only on technical oversold conditions, but the fundamental bearish trend persists
Resistance levels: 4330, 4380
Support levels: 4220, 4163, 4100
A retest of the key zone of interest and a short squeeze could trigger a decline. Locally, gold may consolidate within the 4400–4150 range; however, the technical and fundamental backdrop is bearish, so selling should be prioritized!
Best regards, R. Linda! Short 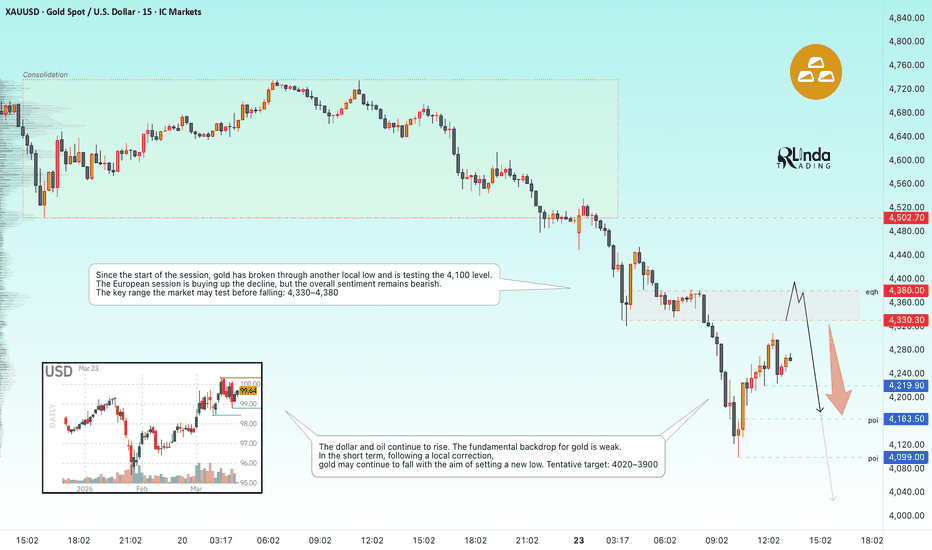
 Short
Short
 Long
Long
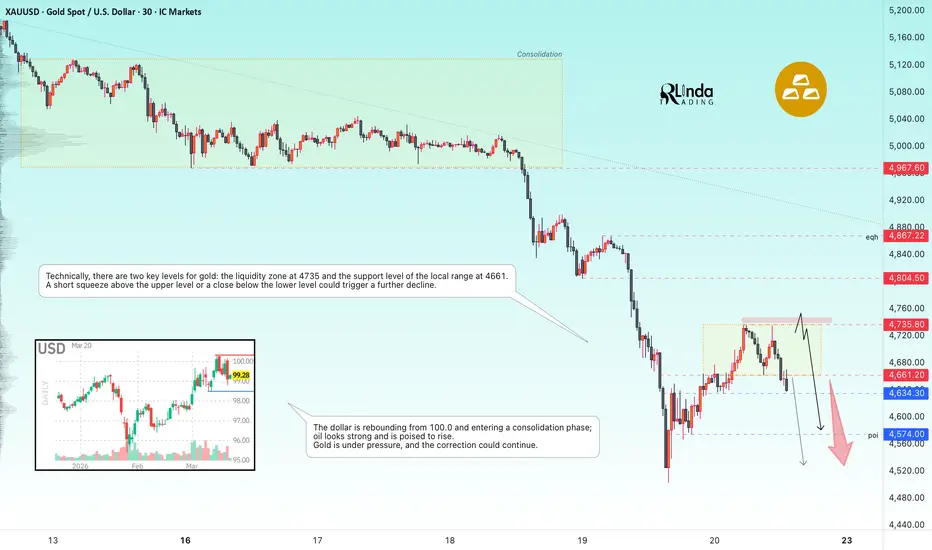
GOLD - The decline may continue ICMARKETS:XAUUSD is correcting after a 7% drop over the week and is testing 4,735, forming a key liquidity zone. The correction is linked to profit-taking and a weaker dollar, but the move may be temporary...
Traders are closing short positions ahead of the weekend and next week’s PMI data. The end-of-week effect is adding volatility.
The escalation of the war (strikes on energy facilities, Iran’s retaliatory strikes) has intensified risk-off sentiment, but gold was sold to cover losses in other markets.
Major central banks have adopted a cautious stance, delaying rate cuts amid the energy shock.
Markets are beginning to rule out expectations of rate cuts this year → negative for gold.
The dollar weakened following central bank decisions (the euro and yen rose), but this did not save gold from a collapse.
Resistance levels: 4661, 4735, 4804
Support levels: 4634, 4574
Technically, there are two key levels for gold: the liquidity zone at 4735 and the local range support at 4661. A short squeeze above the upper level or a close below the lower level could trigger a further decline.
Best regards, R. Linda! Short 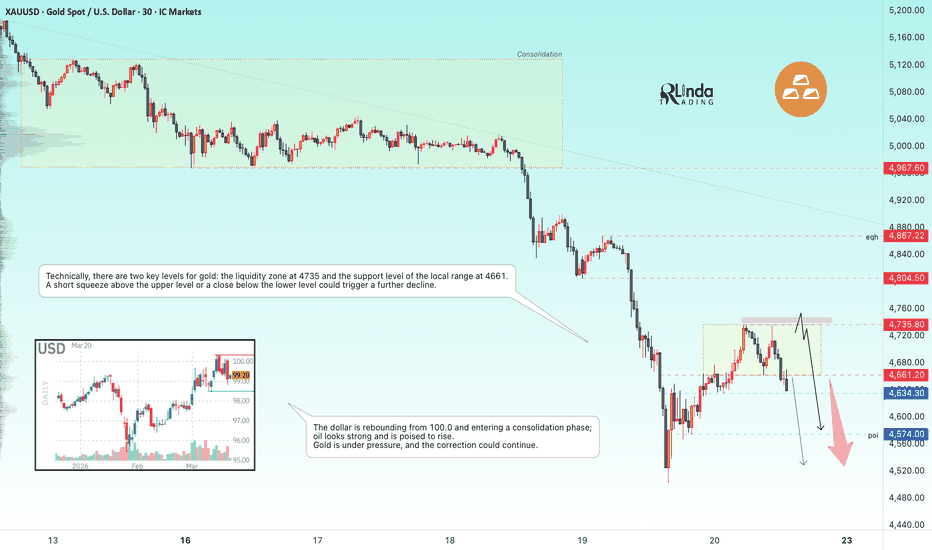
BITCOIN - A hunt for liquidity ahead of a drop to $69000BINANCE:BTCUSDT.P was unable to sustain the previous week’s gains and, following weak economic data, entered a distribution phase from 74,000, testing an intermediate low of 69K. A correction is taking shape...
The global trend is bearish, with pressure on the market coming from weak U.S. indices and the Fed’s hawkish stance. Bitcoin has failed to confirm its status as a safe-haven asset amid the current tense geopolitical situation.
After the sell-off, the price is finding support in the 69,100 zone, confirming the local trend line and forming an additional area of liquidity to which the market may still return
A local rebound and correction toward the 72,400 zone are forming. A short squeeze and bears holding the key zone could trigger a move toward the 69,100 support level.
Resistance levels: 71,750, 72,400
Support levels: 70,220, 69,100
As part of the correction, the price may test the 71,750–72,400 imbalance zone, while a liquidity squeeze and a false breakout could trigger another sell-off and a drop toward the key support level of 69,100
Sincerely, R. Linda! Short 
Gold Rebounds in a Downtrend — Smart Money Buying or Setting a TGold is showing a short-term rebound on the H4 timeframe after an aggressive sell-off.
However, this bounce is happening right below a major descending trendline and inside a potential FVG zone, which raises concern.
Experienced traders know that not all rebounds signal reversals — many are simply liquidity setups before continuation.
Macro Narrative
• The Fed remains firm with its policy stance, keeping rates elevated.
• Stronger USD and bond yields continue to pressure gold.
• No major dovish catalyst has entered the market yet.
• Institutional flows still favor defensive positioning in USD over gold.
News Context
Recent market conditions reflect a continuation of post-Fed positioning, with no major shift in monetary expectations.
Without a clear macro catalyst, price action is being driven more by technical structure and liquidity flows.
IF–THEN News Scenarios
If USD strength persists:
Gold may fail at resistance and continue toward deeper liquidity near 4511 → 4411.
If sentiment shifts (risk-off or dovish tone):
Gold could extend the rebound toward higher resistance levels.
Technical Overview
On the H4 chart, gold remains in a clear bearish structure, respecting a long-term descending trendline.
The current bounce is approaching a Fair Value Gap (FVG) and trendline confluence zone around 4874 – 4957, which may act as strong resistance.
From a professional trading perspective, this type of move often represents a pullback to rebalance inefficiencies before continuation.
If sellers step in at this zone, the next downside targets align with 4511 (support) and deeper liquidity near 4411, where resting orders are likely concentrated.
The structure does not yet show a confirmed reversal — only a potential continuation setup.
Key Levels
Resistance Zone: 4874 – 4957 (FVG + Trendline)
Current Price Area: ~4724
Support: 4511
Major Liquidity Zone: 4411
Market Debate
Is this rebound a smart money accumulation
or just a liquidity trap before the next drop? Short 
XAUUSD - Attempting to recover after a sharp decline.
XAUUSD is attempting to rebound after a heavy correction, but the market is still trading inside a broader pressured structure.
Gold came under strong selling pressure after the US Dollar held firm, with the DXY trading near 99.40 following the Federal Reserve’s decision to keep policy unchanged while maintaining a hawkish stance. That combination kept the dollar supported and forced gold into a deeper correction, as higher-for-longer expectations continued to weigh on upside momentum.
Still, Friday’s price action is beginning to show a different tone.
After the sharp sell-off, gold is now reacting from a key lower demand zone around 4,648, suggesting that buyers are starting to step back in as the market moves towards the end of the week. This does not yet mean the broader pressure has disappeared, but it does open the door for a rebound into the weekly close if price can continue rebuilding structure from current levels.
Technical Structure
From a technical perspective, gold remains under pressure on the higher structure, but the latest move has pushed price into an area where short-term recovery becomes technically reasonable. The chart shows that the recent decline extended aggressively into the lower buy zone before buyers finally responded.
That response matters.
The market is now trying to recover from an oversold leg, and the first thing to watch is whether price can hold above the 4,648 support base. As long as that area remains protected, the rebound scenario stays valid.
The next upside layer sits around 4,851, which marks the first important recovery resistance. If gold can reclaim that level with a firmer reaction, the market may continue rotating higher into 4,958, where another resistance zone is waiting. Above that, the broader upside target opens towards 5,078, which aligns with the upper fair value gap and a much heavier resistance structure.
So while the chart is still technically recovering inside a damaged structure, the path for a Friday rebound is clearly visible if buyers can keep price stable above the current base.
Key Price Zones
Buy Zone / Immediate Support: 4,648
This is the key support holding the rebound scenario together. If gold stays above this area, buyers still have room to lift price into higher recovery levels.
First Recovery Resistance: 4,851
This is the first important barrier on the way back up. A move through this zone would show that the rebound is gaining traction.
Second Resistance: 4,958
This level is the next upside checkpoint. If reclaimed, it would strengthen the case for a broader late-week recovery.
Major Recovery Target / FVG Zone: 5,078
This is the upper resistance area and the more meaningful upside objective if Friday’s rebound extends with stronger momentum.
Market Scenarios
Scenario 1 – Hold Above 4,648 and Rebound Into the Close
This is the preferred scenario for Friday.
If buyers continue defending the current support zone, gold may recover into 4,851 first, then extend towards 4,958. If momentum remains strong into the close, the market could even test the upper imbalance area near 5,078.
This would fit the idea of a sharp correction followed by a recovery rebound to finish the week.
Scenario 2 – Bounce Into Resistance, Then Stall
Even if gold rebounds, resistance still has to be respected.
A move into 4,851 or 4,958 could still attract fresh selling if the broader bearish pressure remains in control. In that case, the rebound would remain corrective rather than a true reversal.
This is why reclaiming levels is not enough on its own. The market also needs to hold above them.
Scenario 3 – Lose 4,648 and Keep the Structure Heavy
If price falls back below 4,648 with clear downside acceptance, the rebound scenario weakens quickly.
That would suggest the current bounce is failing and that sellers are still controlling the short-term direction. In that case, Friday may finish with pressure still dominating rather than easing.
Market Insight
Gold is not trading in a clean bullish environment right now.
The stronger dollar, the Fed’s hawkish tone, and the recent damage in structure are all factors that continue to limit upside confidence. But at the same time, the latest sell-off has pushed price deep enough into support to create room for a technical rebound.
That is where the market stands now.
From my perspective, this is a Friday recovery setup, not a confirmed trend reversal. As long as gold can stay above 4,648, the rebound towards 4,851 and 4,958 remains technically valid, with 5,078 as the higher recovery target if momentum improves into the weekly close.
But this still needs confirmation.
In markets like this, the smartest approach is not to assume the rebound is real too early. It is to let the market earn that view level by level. Long 
 Long
Long
 Long
Long
 Long
Long
Short 
XAUUSD- Remains Under Heavy Selling Pressure
XAUUSD stays on the defensive as dollar strength and Fed hawkishness continue to weigh on gold.
Gold remains under strong downside pressure as the market adjusts to a firmer US dollar and a more hawkish Federal Reserve stance. The Fed kept rates unchanged at 3.50%–3.75% in its March meeting, while Powell signalled that higher oil prices linked to Iran could lift inflation in the short term. That matters because when inflation risks stay elevated, the market becomes more cautious on rate cuts, Treasury yields tend to stay supported, and the dollar gains strength. In that environment, gold usually struggles to hold firm.
From a macro perspective, this is not the kind of backdrop that supports aggressive upside in gold. A stronger dollar and reduced expectations for Fed easing are both working directly against the metal, and the chart is now reflecting that pressure clearly.
Technical Structure
From a technical standpoint, gold is trading in a clear bearish structure. Price has already broken below the descending support trendline and is now pressing into the lower demand zone around 4,750–4,780.
The structure currently shows:
price has lost trendline support
the market is testing the 4,750–4,780 reaction zone
if this area fails, the next major downside target opens near 4,550
any short-term rebound should still be treated as corrective while price stays below broken structure
This is no longer a chart that suggests stability. It is a chart where sellers remain in control and each bounce is at risk of being sold into again.
Key Price Zones
Immediate Support: 4,750–4,780
This is the current reaction area. It may trigger a short-term bounce, but it is also the final nearby support before the chart opens lower.
Major Downside Target: 4,550
If current support breaks decisively, this becomes the next major bearish target.
Overhead Pressure:
Any rebound into previously broken structure should still be watched carefully, because sellers may use those rallies to reload.
Market Scenarios
Corrective bounce:
Gold may react from the current support zone and produce a short-term rebound. But unless price reclaims broken structure with real strength, that bounce should still be treated as corrective.
Bearish continuation:
If the 4,750–4,780 support zone breaks cleanly, the downside may extend towards 4,550, which remains the next major target on the chart.
Key takeaway:
As long as gold stays below broken structure, sellers continue to hold the broader advantage.
Market Insight
Gold is now trading under a macro environment that clearly favours the dollar. A more hawkish Fed tone, fading rate-cut expectations, and renewed inflation concerns tied to oil are all reinforcing downside pressure on the metal.
From my perspective, the structure remains firmly bearish unless the market proves otherwise. A technical bounce can still happen from current support, but as long as gold stays below broken levels, the larger risk continues to point lower.
For now, the message is simple: gold is under pressure, and unless support holds with real strength, the path towards 4,550 remains open. Short