EURJPY ANALYSISHey Traders; after seeing the way last week closed it's a clear sign of bearish momentum in the market and we could see a continuation to the downside but right now i have a few scenarios with which the market could retrace to a higher fib level and resistance confluence area before making that sell off or we could see it break and close below the support area retest and continue to the upside
Fibonacci Retracement
GOLD - A pullback before the drop. 4,500?FX:XAUUSD remains in a bearish trend; the retest of 4,650 (the daily resistance level) ended in a decline amid profit-taking...
A hawkish shift by central banks: the Fed, the ECB, the Bank of England, and the Bank of Japan are signaling a possible rate hike due to inflationary risks caused by the energy shock in the Middle East. This fundamentally weighs on gold as a non-yielding asset.
Despite the dollar’s temporary weakness, the fundamental backdrop remains bearish for gold. The path of leas
GBPUSD - The bulls have maintained control of the support levelFX:GBPUSD is returning to a range following a local price manipulation. A breakdown of the local structure is forming amid a market correction and a weakening dollar
Locally, the dollar is entering a correction, while the British pound is strengthening after a failed attempt to break through support. The market has held the decline
The manipulation ends with a long squeeze; bulls have kept the market in the 1.345–1.348 zone. Consolidation above the range’s support level will provide an op
BITCOIN - The uptrend may give way to a correctionBINANCE:BTCUSDT.P , following a short squeeze at 79,500, entered a sell-off and closed below the trendline support, causing panic among traders. A consolidation is forming
Fundamentally, Bitcoin came under pressure due to the decline in the S&P and Nasdaq stock indices. Technically, the smooth uptrend forming against the backdrop of a global bear market may have lacked the momentum to break through 80K, and the market has entered a phase of liquidity hunting. A long squeeze could allow the
GOLD - The market is under pressure. Waiting for news...ICMARKETS:XAUUSD , following a decline, is consolidating within the 4555–4607 range. Traders are holding their breath in anticipation of the Fed’s interest rate decision, which will be announced later on Wednesday.
Oil prices and the dollar have resumed their upward trend due to the deadlock in U.S.-Iran negotiations, as well as the UAE’s decision to leave OPEC+. High oil prices are fueling inflation expectations and hawkish bets on the Fed. The market is pricing in a rate held in the 3.5–
SOL/USDT 1D Chart Review🔍 What's going on here?
📦 1. Range (most important)
You have a very clear range:
🔴 Support: ~77.6
⚫ Mid-range: ~88–89
🟢 Resistance: ~90.3 – 98.5
The price has been bouncing between these levels for a while now.
👉 Now we're closer to the middle of the range → slightly below it
meaning: no long or short advantage
📉 2. Current situation (here and now)
Price ~83
Rejection from around 88–89 (mid resistance)
A lower high is forming (bearish signal)
👉 This suggests:
short-term downside advantage
GOLD-XAUUSD | (1D) | Swing Analysis | Prof.TraderTilki 📊 XAUUSD-GOLD Analysis
Guys, greetings,
I prepared a swing analysis for XAUUSD-Gold on the daily timeframe.
🔑 Key level: 4350
➡️ XAUUSD-GOLD current level : 4620,00
➡️ If price holds at this level, target: 5000
⬇️ If it fails and major players break it, target: 3950
Guys, I will continue to share updates here over time.
My only request is that you support my analyses with your likes so I can keep sharing them.
I love each of my followers. It’s thanks to your likes that I cont
EURJPY - The end of the correction will lead to an uptrend FX:EURJPY remains in a bullish trend. Signs of the correction coming to an end are emerging, which generally gives the market a chance to continue its upward movement.
The currency pair has been in a bullish trend since last March. Technically, the bullish structure remains intact. The weak Japanese yen is supporting the euro’s upward movement.
Technically, the price is breaking through the resistance of the local correction and local consolidation. If the bulls keep the price above 186.8
GOLD - Technical AnalysisICMARKETS:XAUUSD bounced off the 4668 support level toward the end of Friday’s session following a long squeeze, thereby breaking the local bearish structure. The market’s next move depends on geopolitical developments.
The dollar closed Friday in the red, and technically, the index looks poised to continue its decline. Oil is stagnant. Gold, technically, is still under pressure from bears, but Friday’s session closed above Thursday’s close, which gives us positive signals, provided that
Visa (V): 30% Upside SetupVisa (V) has been in a strong secular uptrend for over a decade, and the recent weakness over the past year represents a corrective phase largely driven by macro headwinds, namely higher interest rates, valuation compression across large‑cap quality stocks, and a broader market rotation rather than any deterioration in Visa’s underlying business. Technically, price has now completed a clean ABCD (1:1) measured move to the downside, signaling the maturity of the pullback, and is trading into a ke
GOLD - Geopolitics and two scenarios... Gold, under downward pressure, is testing the 4,668 support level. However, technical factors are weak against the backdrop of fundamental and geopolitical developments. Iran may resume negotiations...
Gold remains under pressure due to a combination of strong U.S. data and geopolitical uncertainty, which is driving investors toward the dollar rather than gold. However, the second round of peace talks between the US and Iran is expected to begin today. If the talks take place, combined with
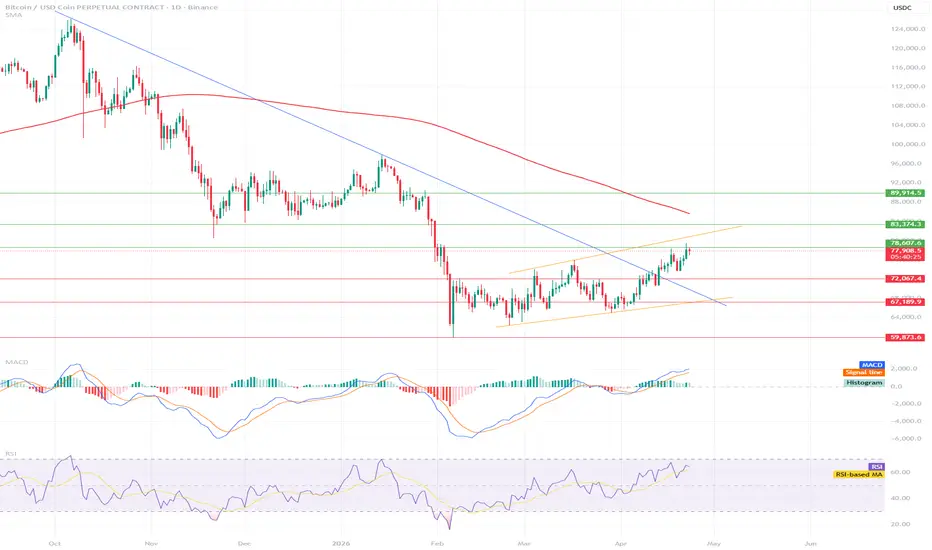
BTC/USDC 1D Chart📉 1. Main Trend
Still a downtrend — visible from:
falling moving average (red line)
previous LH structure (lower highs)
The price is only now testing the broken downward trendline (blue) from below → a classic retest
👉 Conclusion: this is not a bullrun yet, but a potential pullback
📈 2. Short-term Structure
Upward channel (orange) → a healthy rebound
Higher lows and higher highs → a local uptrend
Price reaches:
resistance ~78k
trendline retest + confluence
👉 This is the decision point
🔴 3.
NZDJPY - The uptrend may continue FX:NZDJPY is consolidating above a key daily support zone. The weak Japanese yen could support the currency pair’s rise
The Japanese yen is consolidating within a downtrend. The index is contracting toward support; a break below this level would lead to a further decline in the JPY, which could have a positive impact on the NZD. For this reason, I expect short-term growth.
Consolidation is forming above 93.77–93.89 (above the key daily support). If the bulls hold their ground above this zo
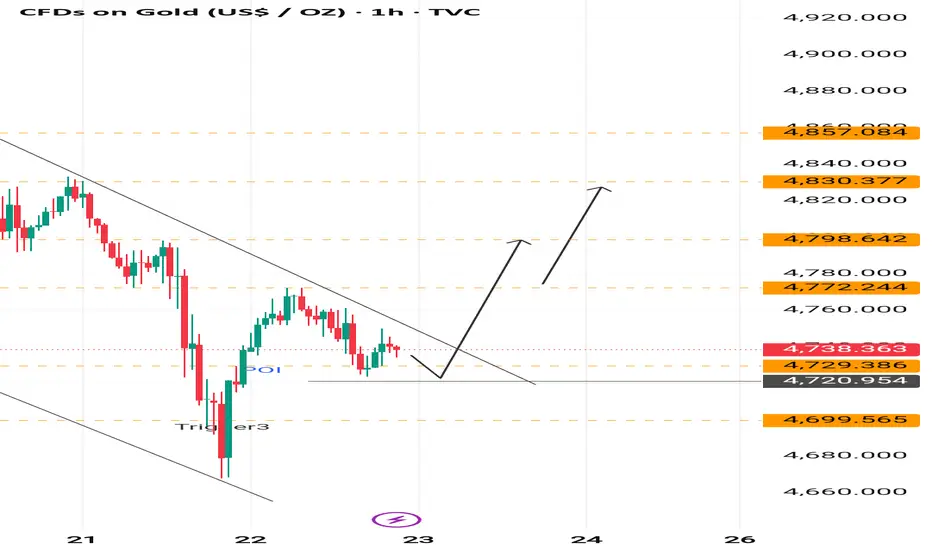
GOLD - A pullback before an upward Gold is forming a long lower wick at a key support zone and is recovering from yesterday’s drop. The move up from the local low has reached around 2.5%. Before continuing the rally, a pullback toward 4738 is possible as traders hunt for liquidity.
Trump’s unilateral extension of the ceasefire has given temporary relief to the dollar and supported gold. However, negotiations remain stalled. Iran is waiting for a “comprehensive proposal” from the US, while port blockades are still in place.
Escala
GOLD - A pullback before an upward move FX:XAUUSD is forming a long squeeze at a key support zone and recovering from yesterday’s decline. The rise from the local low amounted to 2.5%. Before the rally continues, a pullback to 4738 is possible as traders seek liquidity.
Trump unilaterally extended the ceasefire, giving the dollar a temporary respite and supporting gold. However, negotiations have stalled; Iran is waiting for a “comprehensive proposal” from the U.S., and the port blockades remain in place.
Threats of escalation (gol
US100 Weekly : approaching to recent Top around 28k ?Applying reverse fib, we may find that we have already entered a selling zone from 26k to 28k.
Weekly divergence is slowly appearing on the chart.
Around this zone approaching to 28k, we will make a 2nd top and then a healthy correction will be seen till 20k-18k.
let's see how it plays in the end.
BITCOIN - The bulls may prove themselves...BINANCE:BTCUSDT.P is showing signs of a bullish trend on a local scale. The asset has been forming a bullish trend since April. Focus on the key resistance level of 76,000
Bitcoin is forming a medium-term uptrend that began in early April. The price will continue to test the resistance zone of 76,000–76,300
A local bullish structure is forming, within which Bitcoin is attempting to break through the 76K resistance level. If the bulls maintain control of this area, we will see potential for
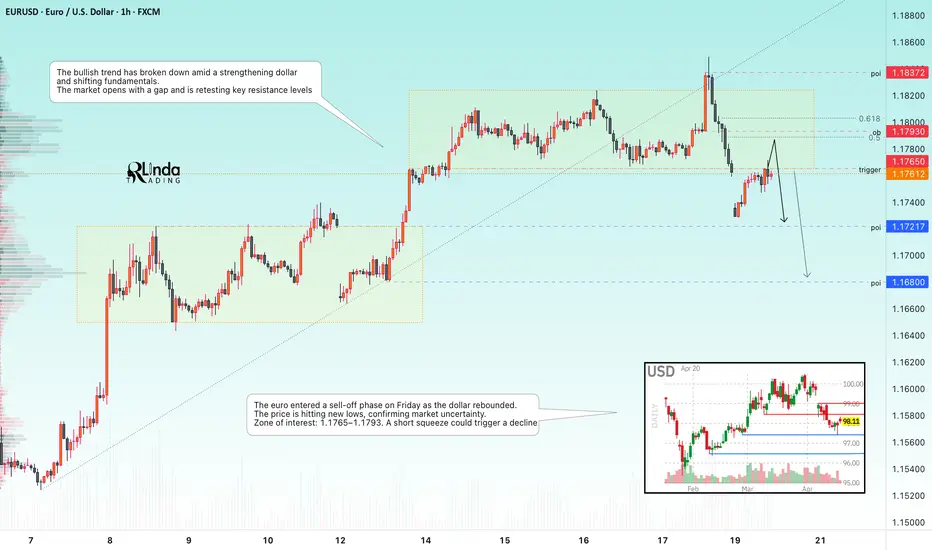
EURUSD - A short squeeze could trigger a drop to 1.168FX:EURUSD is shifting its market tone amid changing fundamentals. Negative sentiment is triggering a sell-off and causing the session to open with a gap.
The currency pair is breaking its bullish structure amid a strengthening dollar and shifting fundamentals. The market opens with a gap and is retesting key resistance levels.
The euro entered a sell-off phase on Friday amid a dollar rebound. The price is hitting new lows, confirming market doubts. Zone of interest: 1.1765 – 1.1793. A shor
GOLD - The market didn't trust Friday's positive newsICMARKETS:XAUUSD reacted positively to the de-escalation of the conflict in the Middle East on Friday; however, a couple of hours later, the market lost faith in the news and resumed selling...
Iran closed the Strait of Hormuz in response to the breakdown of the ceasefire in Lebanon. The geopolitical backdrop is deteriorating. The market may react aggressively to any escalation: the dollar and oil up, gold down.
Direct peace talks with the U.S. have been suspended until Washington changes
ETH/USDT (4H)📈 Trend and Structure
General: The uptrend (HH + HL) is still in effect.
The price is moving within an upward channel, but:
It recently made a lower high → the first signal of weakening.
Currently, we are closer to the middle of the channel, after a bounce from the bottom.
🔑 Key Levels
🟢 Resistance:
2415 – 2466 → a strong supply zone (rejection)
Breaking this out = trend continuation
🟢 Local:
2330 – 2350 → current fight (pivot)
🔴 Support:
2269 → a very important level (already defended)
2195
211
GBPCHF | (1H) Trend Analysis | Prof.TraderTilkiGuys, greetings,
GBPCHF has broken its uptrend. Therefore, my target level is 1.05279.
📉 Best sell entry point: 1.05852
🎯 Target level: 1.05279
However, even if the price doesn’t reach that entry point, I believe it will still move toward my target.
After many requests, I have started sharing signals with you again. My only request is that you support my analyses with your likes.
I love each of my followers. It’s thanks to your likes that I continue to share these analyses. 💛