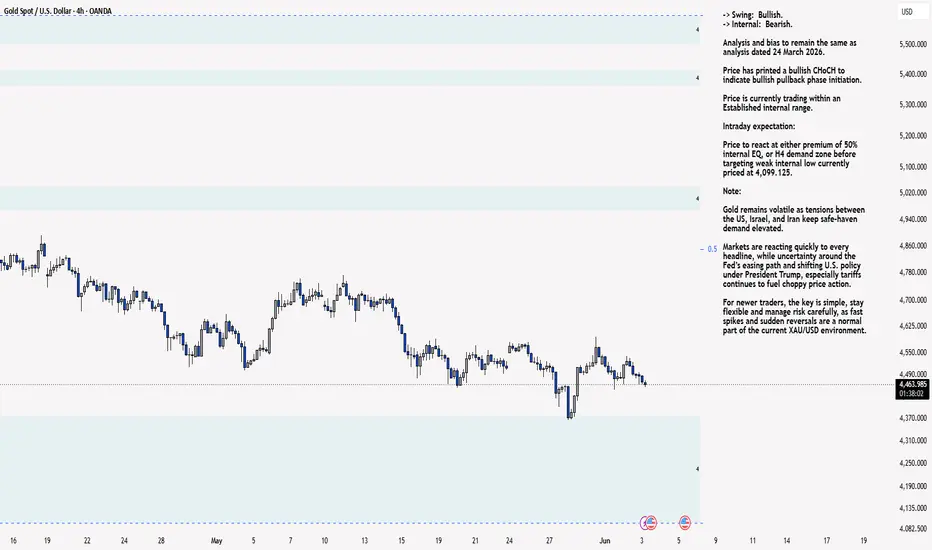
XAU/USD 03 June 2026 Intraday AnalysisH4 Analysis:
-> Swing: Bullish.
-> Internal: Bearish.
Analysis and bias to remain the same as analysis dated 24 March 2026.
Price has printed a bullish CHoCH to indicate bullish pullback phase initiation.
Price is currently trading within an Established internal range.
Intraday expectation:
Price to react at either premium of 50% internal EQ, or H4 demand zone before targeting weak internal low currently priced at 4,099.125.
Note:
Gold remains volatile as tensions between the US, Israel, and Iran keep safe‑haven demand elevated.
Markets are reacting quickly to every headline, while uncertainty around the Fed’s easing path and shifting U.S. policy under President Trump, especially tariffs continues to fuel choppy price action.
For newer traders, the key is simple, stay flexible and manage risk carefully, as fast spikes and sudden reversals are a normal part of the current XAU/USD environment.
H4 Chart:
M15 Analysis:
-> Swing: Bearish.
-> Internal: Bullish.
Analysis and bias to remain the same as analysis dated 01 June 2026.
Price has not printed according to my analysis dated 28 May 2026.
Price did not target weak internal low, instead printing a bullish iBOS. However, I am not entirely convinced of the bullish iBOS to the insignificant nature of the iBOS.
Nonetheless, I shall follow a systematic procedure and classify this as an iBOS.
Price has subsequently printed a bearish iBOS to indicate, but not confirm bearish pullback phase initiation.
Intraday expectation:
Price to trade down to either discount of 50% internal EQ, or M15 demand zone before targeting weak internal high, priced at 4,595.330.
Note:
Gold remains highly reactive on the M15 as geopolitical risk continues to drive quick, headline‑led moves.
The tension between the US, Israel, and Iran is keeping safe‑haven demand elevated, with markets still sensitive to any sign of escalation.
At the same time, shifting US tariff policy under President Trump is adding extra uncertainty, fuelling sharp intraday swings and increasing the likelihood of sudden sentiment flips. Liquidity pockets and whipsaws remain common, making disciplined risk management essential.
Gold’s geopolitical premium is still firmly in place, and until tensions ease, short‑term volatility is likely to stay front‑loaded.
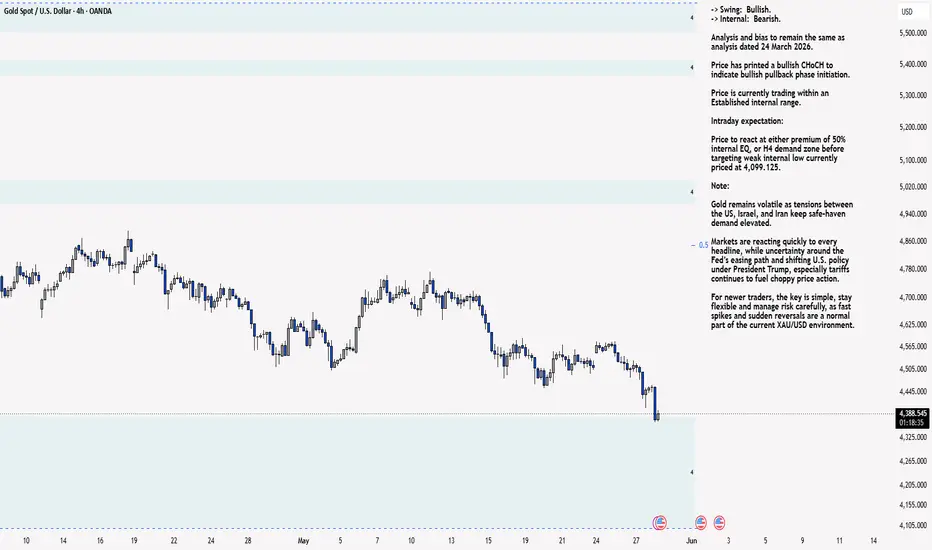
M15 Chart: XAU/USD 02 June 2026 Intraday AnalysisH4 Analysis:
-> Swing: Bullish.
-> Internal: Bearish.
Analysis and bias to remain the same as analysis dated 24 March 2026.
Price has printed a bullish CHoCH to indicate bullish pullback phase initiation.
Price is currently trading within an Established internal range.
Intraday expectation:
Price to react at either premium of 50% internal EQ, or H4 demand zone before targeting weak internal low currently priced at 4,099.125.
Note:
Gold remains volatile as tensions between the US, Israel, and Iran keep safe‑haven demand elevated.
Markets are reacting quickly to every headline, while uncertainty around the Fed’s easing path and shifting U.S. policy under President Trump, especially tariffs continues to fuel choppy price action.
For newer traders, the key is simple, stay flexible and manage risk carefully, as fast spikes and sudden reversals are a normal part of the current XAU/USD environment.
H4 Chart:
M15 Analysis:
-> Swing: Bearish.
-> Internal: Bullish.
Analysis and bias to remain the same as yesterday's analysis dated 01 June 2026.
Price has not printed according to my analysis dated 28 May 2026.
Price did not target weak internal low, instead printing a bullish iBOS. However, I am not entirely convinced of the bullish iBOS to the insignificant nature of the iBOS.
Nonetheless, I shall follow a systematic procedure and classify this as an iBOS.
Price has subsequently printed a bearish iBOS to indicate, but not confirm bearish pullback phase initiation.
Intraday expectation:
Price to trade down to either discount of 50% internal EQ, or M15 demand zone before targeting weak internal high, priced at 4,595.330.
Note:
Gold remains highly reactive on the M15 as geopolitical risk continues to drive quick, headline‑led moves.
The tension between the US, Israel, and Iran is keeping safe‑haven demand elevated, with markets still sensitive to any sign of escalation.
At the same time, shifting US tariff policy under President Trump is adding extra uncertainty, fuelling sharp intraday swings and increasing the likelihood of sudden sentiment flips. Liquidity pockets and whipsaws remain common, making disciplined risk management essential.
Gold’s geopolitical premium is still firmly in place, and until tensions ease, short‑term volatility is likely to stay front‑loaded.
M15 Chart:  Long
Long
 Short
Short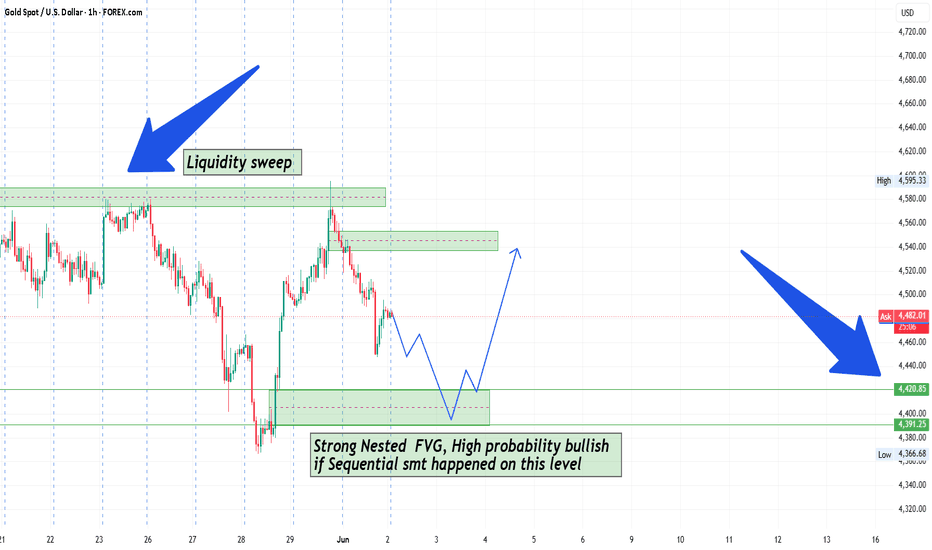
XAU/USD 01 June 2026 Intraday AnalysisH4 Analysis:
-> Swing: Bullish.
-> Internal: Bearish.
Analysis and bias to remain the same as analysis dated 24 March 2026.
Price has printed a bullish CHoCH to indicate bullish pullback phase initiation.
Price is currently trading within an Established internal range.
Intraday expectation:
Price to react at either premium of 50% internal EQ, or H4 demand zone before targeting weak internal low currently priced at 4,099.125.
Note:
Gold remains volatile as tensions between the US, Israel, and Iran keep safe‑haven demand elevated.
Markets are reacting quickly to every headline, while uncertainty around the Fed’s easing path and shifting U.S. policy under President Trump, especially tariffs continues to fuel choppy price action.
For newer traders, the key is simple, stay flexible and manage risk carefully, as fast spikes and sudden reversals are a normal part of the current XAU/USD environment.
H4 Chart:
M15 Analysis:
-> Swing: Bearish.
-> Internal: Bullish.
Price has not printed according to my analysis dated 28 May 2026.
Price did not target weak internal low, instead printing a bullish iBOS. However, I am not entirely convinced of the bullish iBOS to the insignificant nature of the iBOS.
Nonetheless, I shall follow a systematic procedure and classify this as an iBOS.
Price has subsequently printed a bearish iBOS to indicate, but not confirm bearish pullback phase initiation.
Intraday expectation:
Price to trade down to either discount of 50% internal EQ, or M15 demand zone before targeting weak internal high, priced at 4,595.330.
Note:
Gold remains highly reactive on the M15 as geopolitical risk continues to drive quick, headline‑led moves.
The tension between the US, Israel, and Iran is keeping safe‑haven demand elevated, with markets still sensitive to any sign of escalation.
At the same time, shifting US tariff policy under President Trump is adding extra uncertainty, fuelling sharp intraday swings and increasing the likelihood of sudden sentiment flips. Liquidity pockets and whipsaws remain common, making disciplined risk management essential.
Gold’s geopolitical premium is still firmly in place, and until tensions ease, short‑term volatility is likely to stay front‑loaded.
M15 Chart:  Short
Short
XAU/USD 29 May 2026 Intraday AnalysisH4 Analysis:
-> Swing: Bullish.
-> Internal: Bearish.
Analysis and bias to remain the same as analysis dated 24 March 2026.
Price has printed a bullish CHoCH to indicate bullish pullback phase initiation.
Price is currently trading within an Established internal range.
Intraday expectation:
Price to react at either premium of 50% internal EQ, or H4 demand zone before targeting weak internal low currently priced at 4,099.125.
Note:
Gold remains volatile as tensions between the US, Israel, and Iran keep safe‑haven demand elevated.
Markets are reacting quickly to every headline, while uncertainty around the Fed’s easing path and shifting U.S. policy under President Trump, especially tariffs continues to fuel choppy price action.
For newer traders, the key is simple, stay flexible and manage risk carefully, as fast spikes and sudden reversals are a normal part of the current XAU/USD environment.
H4 Chart:
M15 Analysis:
-> Swing: Bearish.
-> Internal: Bearish.
Bias and analysis to remain the same as yesterday's analysis dated 28 May 2026.
Price has printed according to my analysis dated 21 May 2026 where I mentioned that price to trade up to either premium of 50% internal EQ, or M15 supply zone before targeting weak internal low, currently priced at 4,453.390.
Price has printed a bearish iBOS and subsequently s bullish CHoCH to indicate bullish pullback phase initiation, with price being contained within an established internal range. I will continue to monitor price action with respect to depth of pullback.
You will note that price has reacted at a previous H4 demand zone.
Intraday expectation:
Price to trade up to either premium of 50% internal EQ, or M15 supply zone before targeting weak internal low, currently priced at 4,366.230.
Note:
Gold remains highly reactive on the M15 as geopolitical risk continues to drive quick, headline‑led moves.
The tension between the US, Israel, and Iran is keeping safe‑haven demand elevated, with markets still sensitive to any sign of escalation.
At the same time, shifting US tariff policy under President Trump is adding extra uncertainty, fuelling sharp intraday swings and increasing the likelihood of sudden sentiment flips. Liquidity pockets and whipsaws remain common, making disciplined risk management essential.
Gold’s geopolitical premium is still firmly in place, and until tensions ease, short‑term volatility is likely to stay front‑loaded.
M15 Chart:  Long
Long
XAU/USD 28 May 2026 Intraday AnalysisH4 Analysis:
-> Swing: Bullish.
-> Internal: Bearish.
Analysis and bias to remain the same as analysis dated 24 March 2026.
Price has printed a bullish CHoCH to indicate bullish pullback phase initiation.
Price is currently trading within an Established internal range.
Intraday expectation:
Price to react at either premium of 50% internal EQ, or H4 demand zone before targeting weak internal low currently priced at 4,099.125.
Note:
Gold remains volatile as tensions between the US, Israel, and Iran keep safe‑haven demand elevated.
Markets are reacting quickly to every headline, while uncertainty around the Fed’s easing path and shifting U.S. policy under President Trump, especially tariffs continues to fuel choppy price action.
For newer traders, the key is simple, stay flexible and manage risk carefully, as fast spikes and sudden reversals are a normal part of the current XAU/USD environment.
H4 Chart:
M15 Analysis:
-> Swing: Bearish.
-> Internal: Bearish.
Price has printed according to my analysis dated 21 May 2026 where I mentioned that price to trade up to either premium of 50% internal EQ, or M15 supply zone before targeting weak internal low, currently priced at 4,453.390.
Price has printed a bearish iBOS and subsequently s bullish CHoCH to indicate bullish pullback phase initiation, with price being contained within an established internal range. I will continue to monitor price action with respect to depth of pullback.
You will note that price has reacted at a previous H4 demand zone.
Intraday expectation:
Price to trade up to either premium of 50% internal EQ, or M15 supply zone before targeting weak internal low, currently priced at 4,366.230.
Note:
Gold remains highly reactive on the M15 as geopolitical risk continues to drive quick, headline‑led moves.
The tension between the US, Israel, and Iran is keeping safe‑haven demand elevated, with markets still sensitive to any sign of escalation.
At the same time, shifting US tariff policy under President Trump is adding extra uncertainty, fuelling sharp intraday swings and increasing the likelihood of sudden sentiment flips. Liquidity pockets and whipsaws remain common, making disciplined risk management essential.
Gold’s geopolitical premium is still firmly in place, and until tensions ease, short‑term volatility is likely to stay front‑loaded.
M15 Chart: Title: NQ — Time-Based Swing Points & Fib Extension Precision | Time-Based Swing Points
Every major swing in this sequence printed within a narrow time window around a clock boundary:
03:32 — Swing Low. Price bottomed during the London session, just 2 minutes after the half hour. Marked the low of the entire sequence.
10:37 — Swing High. Morning session peak, 7 minutes after the full hour. Price stalled precisely at the -1.5 Fib Extension level.
02:39 — Swing Low. Asian session pullback low, 9 minutes after the half hour. Preceded the large expansion leg.
08:23 — Swing High. New high of the week, 23 minutes after the full hour — slightly wider window, but still the dominant reversal point of the session.
10:33 — Swing Low. Rejection after the 08:23 high, 3 minutes after the half hour. Clean structural low before the afternoon range.
18:02 — Swing High (right side of chart). 2 minutes after the full hour. Price reacted off the 50% Dealing Range level.
03:00 — Final low visible on the right edge. On the full hour exactly.
The pattern is consistent: market participants are clearing liquidity and reversing at measurable clock intervals. This is not random — these windows align with institutional order delivery periods.
Fibonacci Extension Confluences
The following Fib levels acted as exact reaction points:
-1 Fib Extension — Capped the initial rally out of the FVG base. Price stalled here for multiple candles before the 03:32 low.
-1.5 Fib Extension — Hit precisely at the 10:37 swing high. Single-candle reaction, no overshoot. Clean level.
-2.5 Fib Extension — Terminal point of the entire expansion move. The 08:23 high printed at 30,362.50, which aligns exactly with the -2.5 extension from the base range. This was the week's high.
The -1 → -1.5 → -2.5 sequence is a textbook measured extension ladder. Price did not pause at -2 — it skipped directly to -2.5, which confirms strong directional delivery rather than a choppy grind.
Additional Observations
FVG base (bottom of chart, ~29,500 area): Price spent the first session sweeping below this zone before reclaiming it. The entire rally originated from this reclaim. The FVG held as support throughout the week — it was never broken from below again.
Breaker block (around 30,113–30,130 area): After the -2.5 high at 08:23, price broke down through this level during the 10:33 selloff and subsequently used it as resistance on the 18:02 retest. Classic breaker behaviour — support flipped to resistance.
50% Dealing Range (30,113–30,130): Coincides with the Breaker. The 18:02 swing high printed exactly at this level. Double confluence — Fib midpoint + structural breaker = clean reaction.
PDL (Previous Day Low) at 29,743: Visible on the right side as the next downside target. Price was approaching this level at the end of the chart, suggesting continuation risk into this level if the Breaker holds as resistance.
-75.75: Annotated below PDL. This level was not reached during the charted period but remains a draw on liquidity if price continues lower.
Summary
The week delivered a clean directional expansion from the H1 FVG base to the -2.5 Fib Extension — a full measured move. Every significant turning point printed at a time-based marker. The -1.5 and -2.5 extensions provided exact exit targets with no guesswork required.
Structure was respected. Levels were respected. Time was respected.