EURUSD TP 1.1720On the 4-hour chart, EURUSD has stabilized and is trending upward, with the short-term price action forming a potential Head and Shoulders Bottom pattern. Attention is currently focused on the resistance level near 1.1660; a breakout above this level would target the resistance area around 1.1720.
Head and Shoulders
ARKADE DEVELOPERS🏗️ Arkade Developers – H&S Breakout Watch! 🏗️
📊 Setup: Daily chart flashing a clean Head & Shoulders formation.
🔑 Key Levels:
Support: ₹131.00 zone.
Resistance: ₹150.00 neckline in play.
🚀 Upside Potential: Breakout above ₹150 could fuel sharp upside momentum.
💡 Why Traders Care:
Head & Shoulders is a classic reversal pattern.
Daily timeframe adds conviction to the move.
Buy/Sell signals lining up with breakout zone.
⚡️ My Take: Arihant Developers is coiling for a reversal — breakout abov
CRUDE OIL(USOIL): Bullish Reversal Confirmed?!Crude Oil formed an inverted head and shoulders pattern on an hourly timeframe following a test of a significant intraday support level.
The price successfully violate the neckline of this pattern earlier today and closed above it.
There is a high probability that the price will continue its upward trajectory and soon reach the 95.00 level.
NZDUSD: Focus on 0.5815 SupportOn the 4-hour chart, NZDUSD is trending lower in a choppy manner, with the short-term price action forming a potential Head and Shoulders top pattern. Attention is currently focused on the support level near 0.5815; a break below this level would likely lead to further downside, with a downside target set for the 0.5680–0.5730 zone.
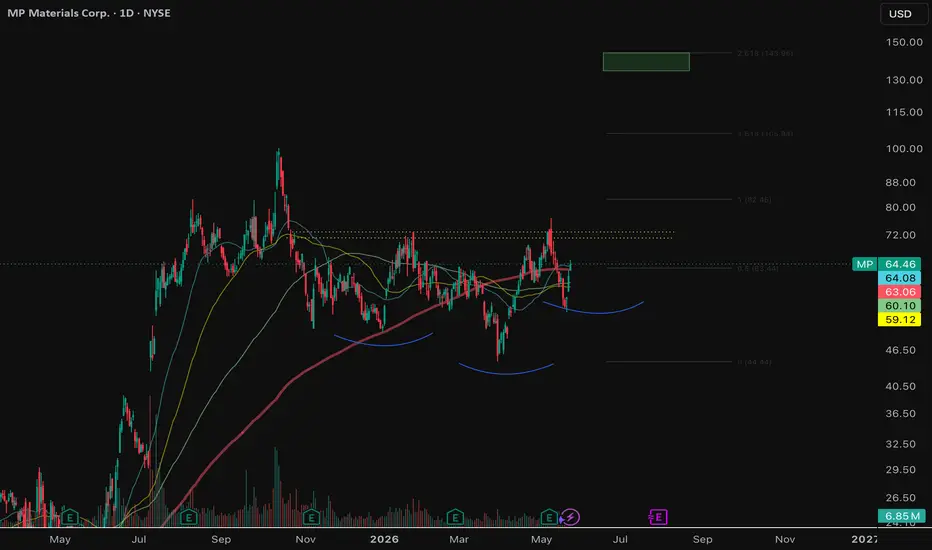
IFBIND | Inverted Head & Shoulders FormingBias: Bullish (Pattern in Progress)
IFB Industries is forming a potential Inverted Head & Shoulders pattern on the daily timeframe. The right shoulder is still developing — this is a pattern to watch, not yet a confirmed breakout.
Pattern Structure:
• Left Shoulder — formed around Jan 2026
• Inverted Head — deepest low ~Feb 2026, with a clean rounded bottom
• Right Shoulder — currently forming (May 2026), low printed near ₹1,037
• Neckline — ~₹1,253.70 (breakout level)
Key Observation — Volum
XAUUSD 15M | Bearish Head & Shoulders Breakdown + Retest SetupGold has broken below a clear Head & Shoulders neckline / ascending support structure, shifting short-term order flow bearish.
What I’m seeing:
🔹 Rising support got violated with strong bearish momentum
🔹 Price is now reacting near a potential supply / neckline retest zone (4550–4556)
🔹 If sellers defend this area, continuation toward liquidity below becomes likely
Trade thesis:
📍 Entry zone: Retest of 4550–4556 supply
🎯 TP1: Equal lows liquidity around 4515
🎯 TP2: Measured move projection nea
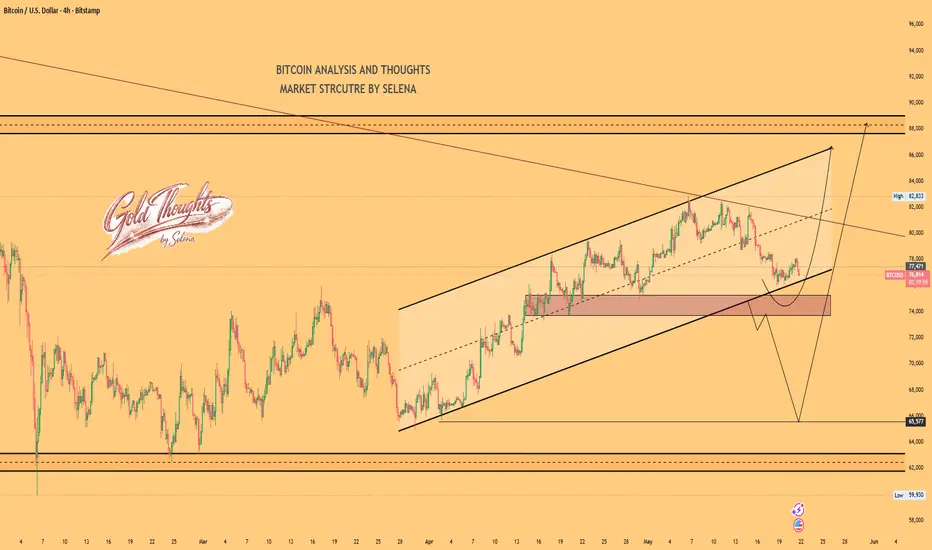
Selena | BTCUSD 4H – Rising Channel Holding Near Key Support BITSTAMP:BTCUSD
Market Overview
The market remains inside a bullish higher-low structure despite recent selling pressure. Current price action suggests BTC is approaching a major decision zone. Holding above support may trigger another bullish expansion toward upper resistance, while a breakdown could open deeper downside liquidity.
Key Scenarios
✅ Bullish Case 🚀
🎯 Target 1: 82,000
🎯 Target 2: 86,000
🎯 Target 3: 88,000+
❌ Bearish Case 📉
🎯 Downside Target 1: 72,000
🎯 Downside Target 2: 65,000
C
GOLD - Bullish ScenarioHello traders,
Gold has formed an Inverted Head and Shoulders pattern.
Now, let’s focus on the bullish scenario:
If the market breaks and closes above the neckline (4570.895 – 4589.580),
we could see a strong bullish move.
🎯 TARGET: 4670.000
Stay patient and wait for confirmation before entering the trade.
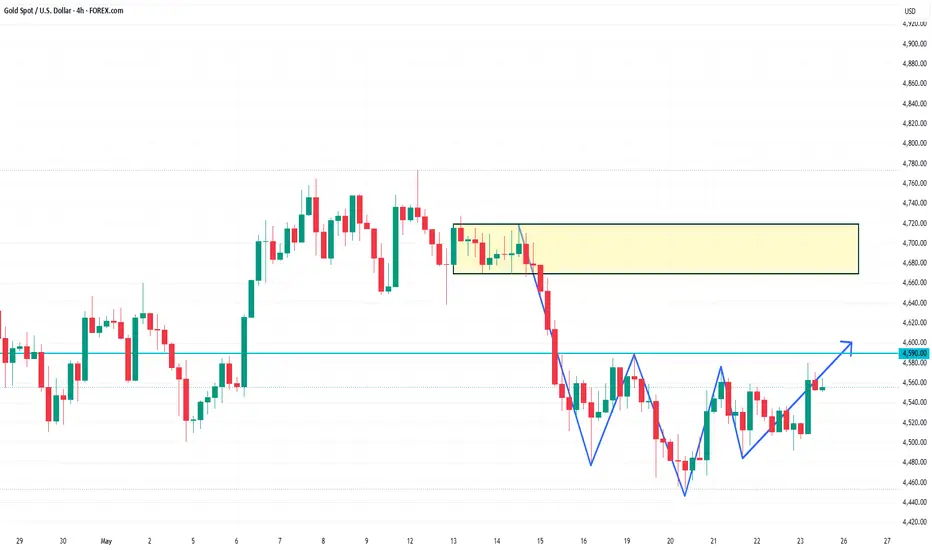
XAUUSD is poised to break through 4590On the 4-hour chart, XAUUSD has formed a potential Head and Shoulders Bottom pattern. Attention is currently focused on the resistance level near 4590; a breakout above this level would likely pave the way for further upside, with the 4670–4720 zone serving as the next resistance area to watch.
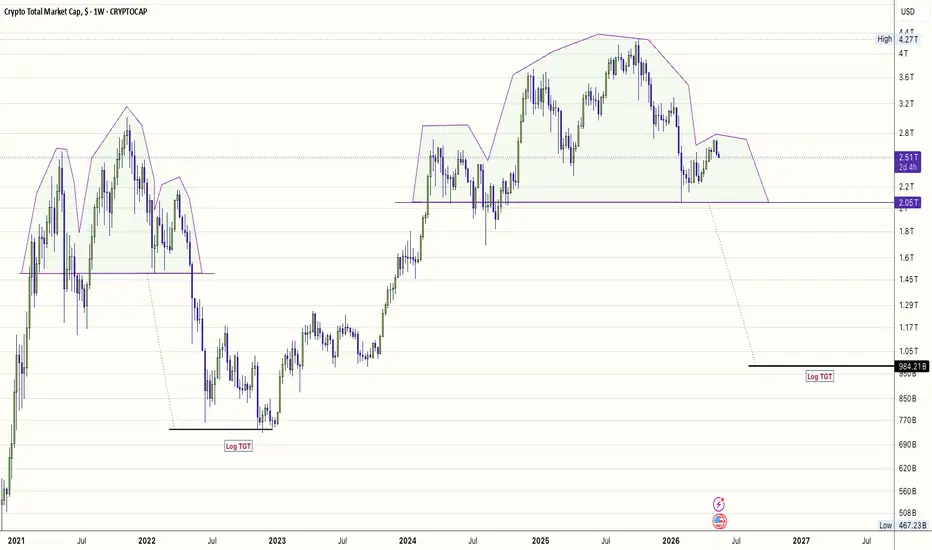
When to "Leave the Trenches" and Why Hope is a Losing Strategy.The 18-Year Mirage:
We have been sold the same story for nearly two decades: This is the cycle/year of mass adoption.
We were promised a global currency, a decentralised replacement for the financial system, and a utility-driven revolution.
The Reality:
18 years in, and what is the core utility?
It is almost exclusively speculative trading.
The industry peddles "global adoption" narratives to keep the liquidity flowing, but the underlying technology—despite its engineering brilliance—has
GOLD (XAU/USD): Another Bullish Pattern⚠️Gold shows perfect adherence to an ascending trend line on an hourly chart, subsequently experiencing a bounce.
I am now observing a strong bullish pattern in this context. The price has formed a head and shoulders pattern and is testing its neckline.
The subsequent bullish confirmation to anticipate is a breakout. An hourly candle closing above the 4534 level would validate this breakout.
A continuation of the bullish trend would then be expected.
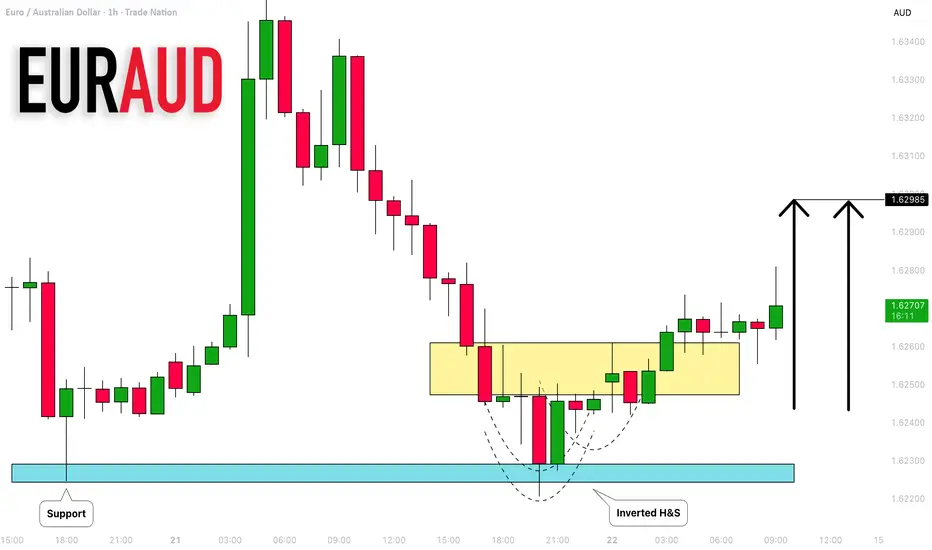
EURAUD: Pullback From Support 🇪🇺🇦🇺
EURAUD will likely pull back from a strong intraday support
after a breakout of the neckline of an inverted h&s pattern on an hourly time frame.
Expect a bullish movement to 1.6299
❤️Please, support my work with like, thank you!❤️
I am part of Trade Nation's Influencer program and receive a monthly fee for using their TradingView charts in my analysis.
NIFTY CORE HOUSING INDEX🏠 Nifty Core Housing – H&S Breakout Watch! 🏠
📊 Setup: Daily chart flashing a clean Head & Shoulders formation.
🔑 Current Price Range: 12,500 – 17,000.
🛡️ Support: Strong base at the Right Shoulder zone.
🚀 Upside Potential: Breakout above neckline could fuel a sharp rally.
💡 Why Traders Care:
Head & Shoulders is one of the most reliable reversal patterns.
Daily timeframe adds conviction to the move.
Buy/Sell signals lining up with the breakout zone.
⚡️ My Take: Nifty Core Housing is coiling
EURGBP has formed a potential Head and Shoulders top patternOn the weekly chart, EUR/GBP has formed a potential Head and Shoulders top pattern, indicating that short-term bearish sentiment prevails. Current support lies near 0.860; a break below this level would open up further downside potential, with downside targets set for the 0.835–0.845 zone.
DEEPAKFERTDeepakfert forming inverted head & shoulder pattern. The stock has already picked momentum and trading above all essential moving average. The result is on 26-May. Once it get market participation it gonna get next rally. Support seems near 1275. And pattern target can be seen near 1800. Keep it in yr watchlist.
Around 50% off from hereMy previous idea didnt turn out so well, after the massive rally from end of March! But still very much of the opinion that we will end up at the same place at 12/16k, due to the bigger picture as i see it. So around 50% off from current prices. Just somewhat delayed after that extra leg up.
Why? Index is still pricey. Less so that it has been in the past few years, but still elevated and priced for very a optimistic forward situation. But i still see the big picture remaining more or less the
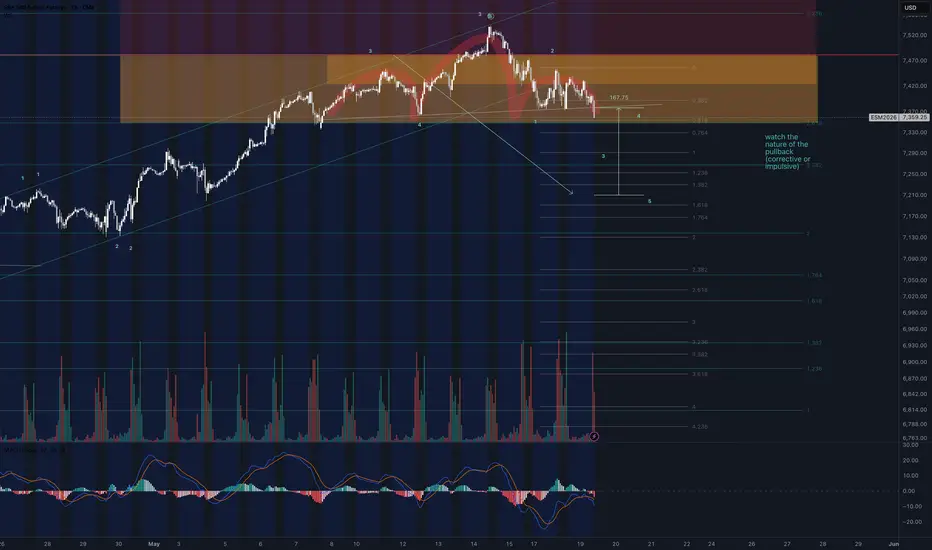
MESM May 20: Sweep of 7362, now watching 7440 and 7475MESM analysis for Wednesday, May 20
MESM already swept the downside liquidity at 7362 and bounced, and now price is trading around 7400. Because of that, my first expectation for today is a push higher into the 7440 area.
On the 4H chart, 7440 is the first upside level I’m watching. Once price reaches that level, I’ll be looking closely for a reaction because there is still overhead supply sitting above price.
If bulls stay strong after that and we eventually get a 4H candle close above 7475,