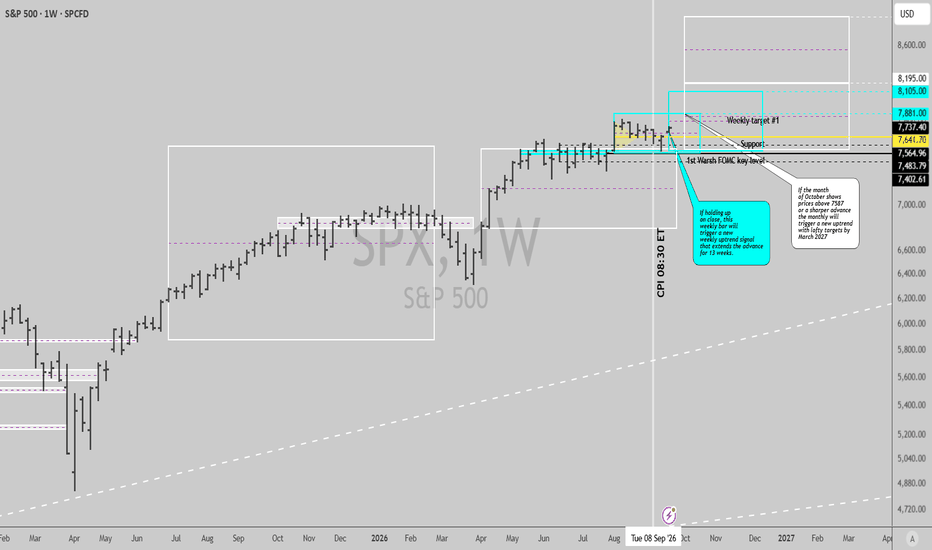
SPX Time@Mode #2: Downtrend erased, Friday decides the advanceThe SPX weekly downtrend triggered on the 9/16 FOMC hike and has been retraced away: the bar trades 7,696.42 on Monday, back above the range the signal was built on.
This week the tape has to trade the hike into September's live data calendar without the FOMC available as a hiding place: S&P Global Flash PMI Wednesday, Initial Jobless Claims and New Home Sales Thursday, Durable Goods and the SCOOS credit survey Friday, plus Xi Jinping in Washington and Costco after the Thursday close.
Fed gov
Investing
S&P 500 Daily Chart Analysis For Week of Sep 18, 2026Technical Analysis and Outlook:
In last week's trading session, the Spooz dropped and rebounded sharply with an eye on the vital Mean Resistance at 7,670, with strong potential to hit the next Mean Resistance identified as 7,722.
Nevertheless, the current trading price action demonstrates a high probability that the S&P 500 index will see steady-to-lower moves in the upcoming session. This would hint at a drop to the Mean Support at 7,610 before rebounding toward the targets stated above.
How
EUR/USD Daily Chart Analysis For Week of Sep 18, 2026Technical Analysis and Outlook:
In last week's trading session, the Eurodollar tumbled to the Mean Support level of 1.146, then bounced sharply to target the Mean Resistance level of 1.150, with a possibility of a further incline to the Mean Resistance level of 1.155, with the respective targets serving as In-Force triggering points.
On the downside, the Eurodollar continues to show a bearish bias, targeting the critical outcome identified as the interim Inner Currency Dip, priced at 1.142.
Bitcoin(BTC/USD) Daily Chart Analysis For Week of Sep 18, 2026Technical Analysis and Outlook:
Bitcoin encountered a powerful upward movement in last week's trading session, successfully retesting the Key Resistance level at $81,700.
Following this, the next target price is the completed Inner Coin Rally at $82,200, with an eye on the major advancement to the next Inner Coin Rally at $86,800.
On the downside, the current trading price indicates a likely reignition of the In-Force Retracement to the Mean Support at $78,000, from the Key Resistance level
FSLR: U.S. Solar Tariffs Could Create a Pricing-Power CatalystFirst Solar is setting up an interesting fundamental and technical scenario as the U.S. moves closer to imposing steep anti-dumping and countervailing duties on solar imports from India, Indonesia and Laos.
The key point is not simply that tariffs make imported panels more expensive.
First Solar uses CdTe thin-film technology, while the current trade case focuses on crystalline-silicon photovoltaic products. That gives FSLR a potentially favorable competitive position if imported c-Si modules
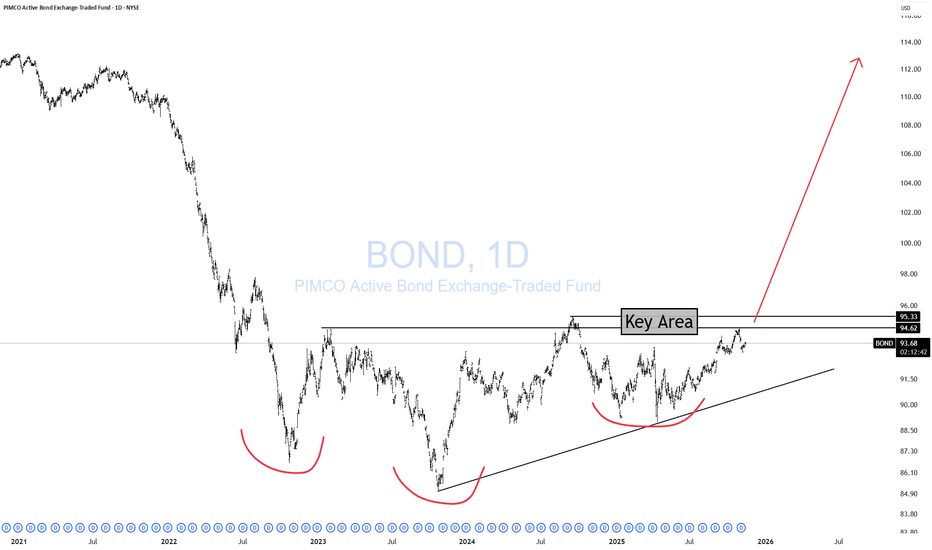
BOND Break Out?💣 Bonds Near a Major Breakout — And It’s Not Bullish for Risk Assets
We’re approaching a critical breakout zone in bonds.
At first glance, you might think: “High demand for U.S. debt? That’s great! Higher bond prices, lower yields, cheaper interest payments!”
That’s Trump-math logic — the same kind that says prices are “down 300%.” 😅 You can only go down 100%, folks. No matter where the price goes!
Here’s the real story:
For bond prices to surge, investors must be running from risk. Big money
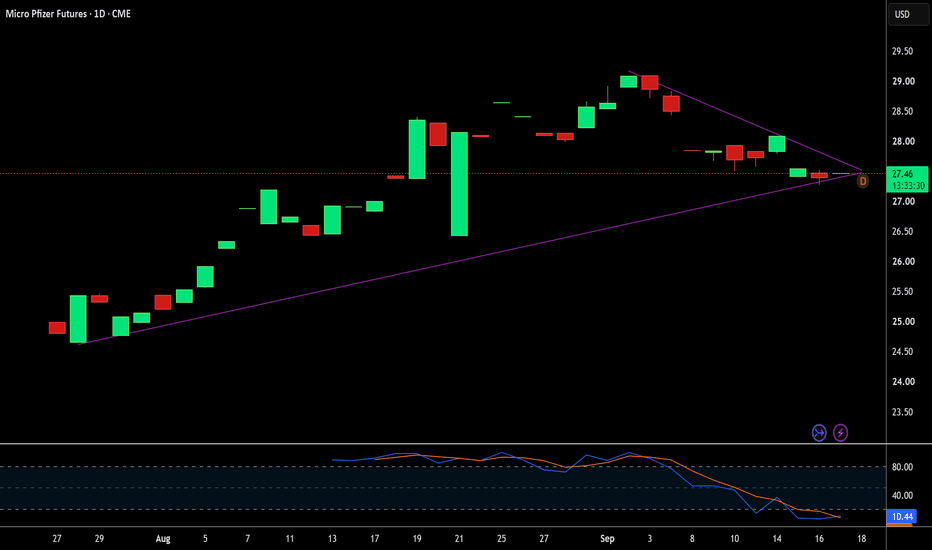
Can Pfizer Outrun Its Massive Post-COVID Patent Cliff?Pfizer stands at a strategic crossroads. COVID-19 demand has normalized hard. Comirnaty fell 34% operationally in Q2 2026, and Paxlovid fell 95%.
Non-COVID therapeutics now carry the enterprise. Excluding Comirnaty and Paxlovid, Q2 revenues grew 5% operationally. Launched and acquired products grew 18% operationally.
Pfizer raised 2026 revenue guidance by $500 million at the midpoint to $60.5 to $62.5 billion. The raise reflects roughly $1.5 billion of better-than-expected non-COVID performanc
Can the Australian Dollar Survive Fed Hikes?Macroeconomic Divergence
The Federal Reserve raised its target range to 3.75% to 4.00% on September 16, 2026. The vote was unanimous at 12-0. This was the first US rate increase since July 2023. Updated projections signal another hike may follow this year.
The move narrowed Australia’s yield advantage without erasing it. The RBA cash rate sits at 4.35%, still above the new US range. The Reserve Bank hiked three times earlier in 2026, then held in August. Markets now price roughly a 78% chanc
Free Markets Set Rates Not The FED!"Blame the FED" is such a bullscitt excuse for all political economic theories. It's the villain in their cute story where they are the hero.
In reality, it's the free markets that set rates, not the FED. The FED is always late to the party. This time was no different. The Fed raised .25 bp today. A surprise to no one who understands economics and finance.
What is a pleasant surprise is that the FED has not been taken over by Trumpchenko. This keeps the FED's independence & credibility intact.
Market Crash Explained – Why It Happens So FastA market crash rarely begins with one massive red candle.
Usually, it starts much more quietly: price begins to weaken, buyers lose momentum, and a key support level breaks. Then the market suddenly accelerates, and within a short period of time, concern turns into panic.
🔍 1. What Really Causes a Market Crash?
A market falls sharply when the number of people trying to sell far exceeds the number of buyers willing to step in at the current price.
The trigger can be a recession, financial
Will Record Copper Futures Trigger a Global Energy Crisis?Macroeconomics and Economic Realities
Copper futures recently hit historic highs across major global exchanges. COMEX contracts touched a record $6.894 per pound on September 10. London Metal Exchange three-month contracts reached a record $14,858.50 per metric ton the same morning. LME copper has climbed about 19% in 2026 and roughly 48% over twelve months. Hours after that peak, futures fell more than 4% on reports that Washington had not decided on refined copper tariffs. That reversal revea
What Peter Lynch Saw FirstPeter Lynch became one of the most respected investors of his generation by doing something that sounds simple but is extremely difficult: finding businesses that were worth more than the market believed. From 1977 to 1990, he managed the Fidelity Magellan Fund and generated an exceptional long-term return. His approach was not about predicting every market move or finding the next hot stock. It was about understanding businesses, identifying changes in their fundamentals, and recognizing when t
S&P 500 Daily Chart Analysis For Week of Sep 11, 2026Technical Analysis and Outlook:
In last week's trading session, the S&P 500 index (Spooz) dropped sharply to test the crucial Mean Support level at 7,611. It marked this support level by completing an In-Force Retracement movement and establishing a renewed Mean Support at 7,590.
Looking at the potential upside, the Spooz index shows the possibility of rising to the Mean Resistance at 7,695, then extending to the Mean Resistance at 7,750, the Key Resistance at 7,800, and taking another shot at
EUR/USD Daily Chart Analysis For Week of Sep 11, 2026Technical Analysis and Outlook:
In last week's trading session, the Eurodollar bounced back strongly to the Mean Resistance level of 1.165, then sharply retreated to retest the well-established, previously tested Mean Support level of 1.157. There is also a possibility of a further decline to the Mean Support at 1.152.
On the upside, the euro is indicating a potential retest of the robust Mean Resistance at 1.165, with the possibility of breaking out to the Mean Resistance at 1.168. The critic
Bitcoin(BTC/USD) Daily Chart Analysis For Week of Sep 11, 2026Technical Analysis and Outlook:
Bitcoin recently experienced a significant upward movement in the last trading session, successfully retesting the Mean Resistance level at $79,500. It has also established a solid support level at $76,300. Following this, the price identified an Intermediate Inner Coin Dip target at $75,400 and another at $72,200.
On the upside, the price movement indicates a potential intermediate rebound that may lead to another attempt to retest the Mean Resistance at $79,50
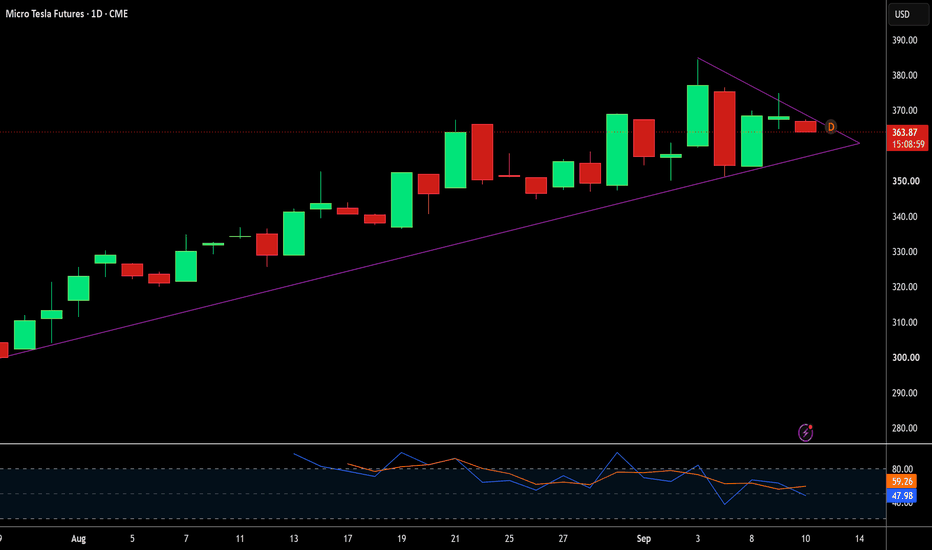
Can Micro Futures Tame Tesla's (TSLA) Volatile AI Future?Wall Street closely monitors Tesla as equity markets navigate shifting interest rate expectations. Micro futures contracts on Tesla now offer traders fractional equity exposure with reduced capital demands. Derivative markets price in substantial price swings following recent vehicle delivery figures and earnings reports. Investors utilize these micro contracts to hedge high-beta tech exposure during volatile trading sessions.
Geopolitical Dynamics and Global Expansion
Regulatory approval acr
Split the entry and the stop moves with it
Most people run one clock over everything they own. One method, one holding period, one way of placing a stop, applied to a two-week idea and a two-year idea alike.
That's how you end up right about a company and stopped out of it anyway.
Take the slow version, a position built around a rising long-term average rather than around a weekly trigger. Price finally arrives in the area you'd been waiting for. Three things are now different from a swing entry, and only one of them is obvious.
Fir
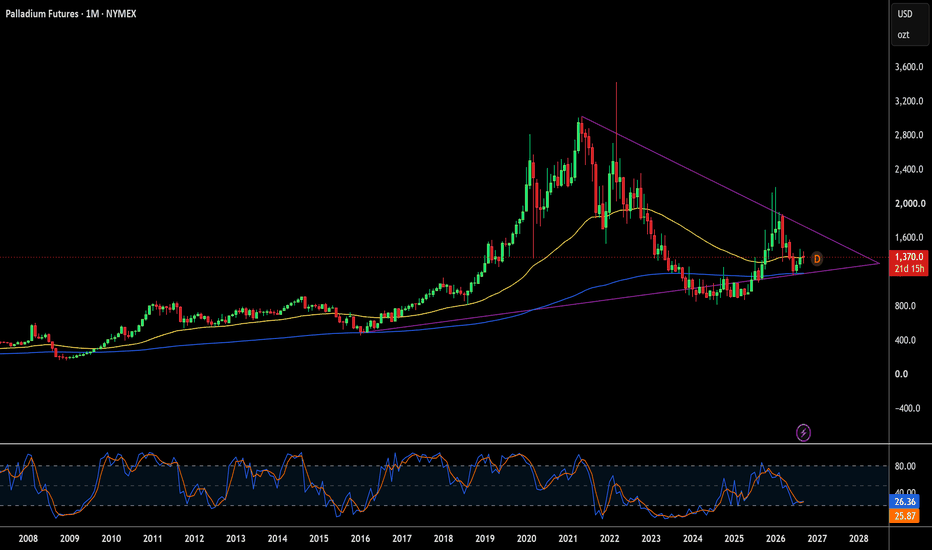
Can Palladium (PA) Futures Break the $1,400 Barrier?Palladium futures recently rallied from June lows near $1,177 to test the key $1,400 resistance level. The metal still trades far below January's peak above $1,900. Geopolitical friction drives this price volatility. Russia's Nornickel commands roughly 40% of global primary palladium output. Western sanctions risk continuously threatens to disrupt these vital export routes. Meanwhile, South African mines face severe power grid instability, aging infrastructure, and rising labor costs. Together,
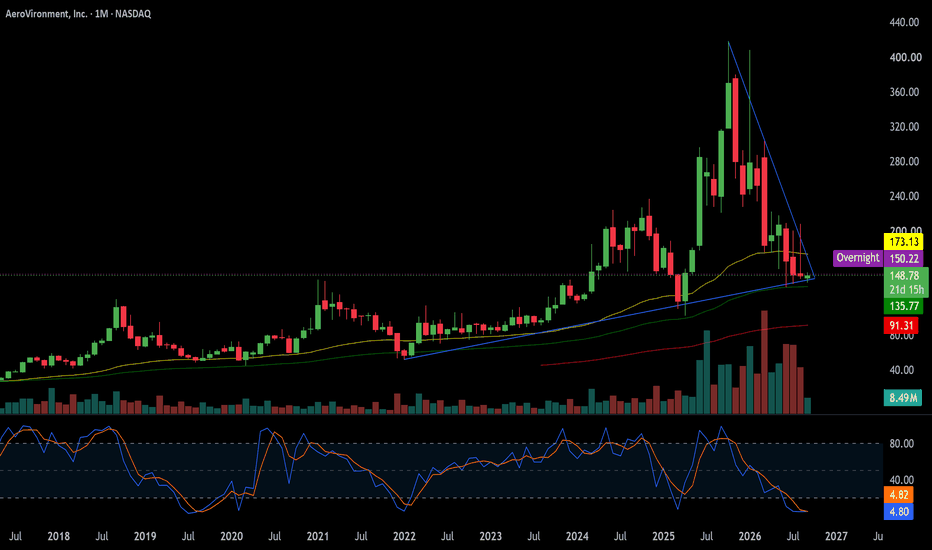
Can AeroVironment Redefine Warfare Economics?AeroVironment approaches its fiscal first quarter 2027 earnings report, due September 9, with massive operational momentum across global defense markets. Fourth quarter fiscal 2026 revenue soared 133.3% year over year to $641.62 million, and adjusted diluted earnings reached $1.84 per share, easily beating Wall Street consensus forecasts. Management targets long-term annual revenues between $3.5 billion and $4.0 billion by FY30. However, rapid scaling created a temporary negative net margin, wit
Trading's Toughest Battle Happens in Your MindMost traders spend years learning technical analysis, studying chart patterns, tracking market news, and searching for the perfect strategy. However, many eventually discover that having a good strategy is only one part of becoming successful. The real challenge often begins when money is at risk and emotions start influencing decisions.
Trading is not just a test of market knowledge. It is also a test of patience, discipline, self-awareness, and emotional control. A trader may know exactly wha
CAT: Excavator digs for bottom. Found it?NYSE:CAT
It seems Caterpillar is getting ready to build not just data centers, but also new all-time highs in our brokerage accounts.
On the industrial horizon, one of the cleanest reversal setups of the year is taking shape. CAT shares have completed a large-scale correction from the all-time high of $1,073.46 and are approaching the most important point of the cycle. The chart is forming a classic potential double bottom pattern right at the 200-day moving average, the primary long-term r
Apple Pulls Back From Resistance — Can Bulls Defend the Uptrend?Market Structure
Apple remains within a broader bullish trend despite the recent pullback from its latest swing high. The series of higher highs and higher lows is still intact, but short-term momentum has weakened after failing to sustain prices above the recent peak. Price is now retracing toward a key support area where buyers will need to step in to preserve the broader uptrend.
Market Sentiment - Moderately Bullish
Overall sentiment remains cautiously bullish. Although recent profit-t
S&P 500 Daily Chart Analysis For Week of Sep 4, 2026Technical Analysis and Outlook:
In the prior week's trading session, the S&P500 index rose progressively higher after retesting the crucial Mean Support level at 7,643 and re-marking the support level to a new Mean Support level of 7,611.
In the upside scenario, the index pattern indicates a retest of In-Force Rebound prices to the Mean Resistance level at 7,767, extending to do-over the completed Outer Index Rally at 7,815, driving through the Key Resistance level marked at 7,800.
Neverthele