Base Building After Trendline Breakout – Is the Next Leg Higher?Presenting another high-probability chart story.
After spending months trading below a well-defined descending trendline, DXCM finally broke above that resistance, signaling a potential shift in the longer-term trend.
As often happens after a major breakout, price returned to retest the broken trendline, successfully confirming it as new support instead of falling back below it.
But what makes this chart even more interesting is what happened next.
Rather than making an impulsive move immedi
Moving Averages
Alphabet Rejection to $300 Scenario in PlayHey traders, Google is looking like it's primed for a rejection here.
There are three main factors:
1. There is a 20-day EMA band here that is currently acting as resistance.
2. This zone is a previous support turned resistance at ~340 to ~350.
3. At $360, that's the top of a daily 20-EMA band. Google has already been rejected multiple times here - so unless that behaviour changes, we have to remain technically bearish.
Keeping the outlook simple today - $320 and $300 could be revisited if we
Why NASDAQ recovered, and how far can this go? [Hint: 29.1K]Nasdaq moved higher yesterday because the KOSPI and SOXX were oversold.
I explain this within the first 5 minutes of the video, and also provide some TA for KOSPI and SOXX if you're trading those assets.
For Nasdaq setups, go to 5:30 for the breakdown.
To be clear, my style of analysis is telling that Nasdaq is still bearish - so while we have a recovery happening, I'd look for a potential rejection:
28.9 to 29.1k zone
If that breaks, Nasdaq is showing significant strength, and I would
Watani Iron Steel (9513) : Confirmation Before the Next Move !!TADAWUL:9513
📈 Weekly Trendline Retest: Waiting for Confirmation Before the Next Move 🇸🇦
The stock has successfully retested its long-term weekly trendline, placing it at a critical technical decision point.
While the setup is becoming increasingly constructive, confirmation is still required before considering a high-conviction entry.
🔍 Technical Outlook
The current price action suggests that the market is attempting to convert the previous resistance into support.
However, rather than
BLK LONG — 4H ALMA Setup (WR 84%)█ SETUP
BlackRock · NYSE:BLK · 4H · long only.
ALMA Averaging Strategy: ALMA 3 / σ2, SD band 2, min diff 6 bar to add / 3 bar to exit, 25% per bar, up to 4 adds, hard stop −10% from average entry.
Strategy Tester (BLK 4H):
Win rate 84% · profit factor 2.5 · max drawdown 9%
Typical hold ~24 bars on winners · asset-manager mean-reversion sleeve
Sister template on same bar (OV8839):
Win rate 83% · profit factor 2.9 · max drawdown 6%
═
█ WHY NOW
Post-PCE Thursday cash open — two indep
Visa (V) LONG — 4H ALMA Setup (WR 80%)█ SETUP
NYSE:V · 4H · long only.
(Context: Visa — global card / cross-border payments network.)
ALMA Averaging Strategy: ALMA 3 / σ2, SD band 2, min diff 4/3, 25% per bar, up to 4 adds, hard stop −10% from average entry.
Strategy Tester (V 4H):
Win rate 80% · profit factor 2.2 · max drawdown 44%
Avg winning trade +7.2% · avg losing trade −6.9%
Typical hold ~63×4H bars on winners — payments mega-cap mean-reversion sleeve
═
█ WHY NOW
Wednesday US cash — fresh 4H ALMA long on 09 Jul
7,440 Remains the Key Level!Hello, traders!
A very brief update on the index today.
🎯💰 The main event was the precise hit of the 7,300 target, followed by a strong reaction from buyers at that level. The rebound looks solid, but the next major level to watch is 7,440, which I’ve mentioned several times before. This area could act as significant resistance and slow the current recovery.
🟢 The green arrows on the chart highlight previous reactions to this level (when price approached it from above), so it shouldn’t be ign
Bitcoin Hits 62.6K — Is 65K the Key to Recovery?Hello, traders!
Over the past week, Bitcoin reached every downside target discussed in my previous analyses.
In my last update, I wrote:
“The final downside target at 62.5K — a key support level where Bitcoin has been consolidating since early June — remains untouched for now. However, with the local trendline now broken, all major moving averages lost, the important 65K level reclaimed by the bears, and little sign of meaningful buying interest, I believe a move toward 62.5K is increasingly
EURUSD | Buy-Side Liquidity Sweep Signals Bearish ContinuationEURUSD continues to present a bearish technical outlook following a buy-side liquidity sweep above the 1.14750 resistance level and the 2 July high, where price failed to sustain bullish momentum before rejecting lower. This liquidity grab suggests that buying pressure may have been exhausted, shifting the focus towards a potential continuation of the prevailing bearish structure. I will be monitoring a retracement into the highlighted retest zone, where multiple technical factors converge, incl
SC (SANTANDER CONSUMER USA HOLDINGS INC) - False BreakMarket structure: Uptrend, price might retest previous resistance turn support, price respecting 50MA
Setup: False Break/ Retest previous resistance turn support
False Break candlestick pattern: Hammer / Bullish engulfing
To look for trading opportunities when price retest previous resistance turn support at around 39.90 area.
Stop loss: 1 ATR stop loss taking reference from the retest
Take profit: Trailing stop
Disclaimer: Below simple trading idea is just for sharing, please do your own due
SLong
TTAN - Reverse Head and Shoulders above the 50 SMA💡 Swing setup idea
Reverse head and shoulders
🔎 Analysis summary:
The stock touched the 50 SMA and bounced, closing a reverse head and shoulders pattern. We can also see very strong buyers volume stepping in, but with the broad market still trending lower, this is one to manage with extra caution.
👀 Levels to watch:
Entry trigger: Break above $84.10
Target: $111.36
Stop: Under the breakout level
💬 What do you think about this setup? Let me know in the comments! 👇
Good luck!
⚠️ Not
GBP/USD | Rejection at Key Supply Favors Move Towards 1.3000GBP/USD has rallied into a key area of technical confluence, where I believe bullish momentum is beginning to lose strength. Following the completion of an A–B–C corrective structure, price has tested a well-defined 4-hour rejection area positioned beneath the 15th June High and in close proximity to the 200-period moving average. This region represents a significant supply zone where sellers have previously demonstrated control. Combined with elevated RSI readings and the completion of the corr
ETH possible shortSuper high risk before the FOMC meeting and interest rate decision later today.
4H uptrend is showing signs of weakness:
-> First bigger and more aggressive pullback happened, printing a lower low
-> 4 times higher high on the 4H chart, but RSI lower low or same
Resistance at 1933:
-> 0.618 and 0.786 exactly overlapping
-> Retesting 200D EMA from the bottom after we broke above and then dropped below again
-> Exactly where late short liquidations are stacked
-> Short Order block sitting ri
New chance if you missed the short!But first — all eyes on the Fed interest rate decision today.
This one is especially interesting because the market is truly split on what will happen.
→ BTC has finally printed a lower high + lower low on the higher timeframes
→ Broken down from the rising trendline
The 65k zone is now sitting right at the confluence of:
• 50d EMA
• 0.618 Fib of the whole range
• 0.786 Fib short-term
• Local resistance from the VWAP of the 67k top
However, the rate decision will be the real cata
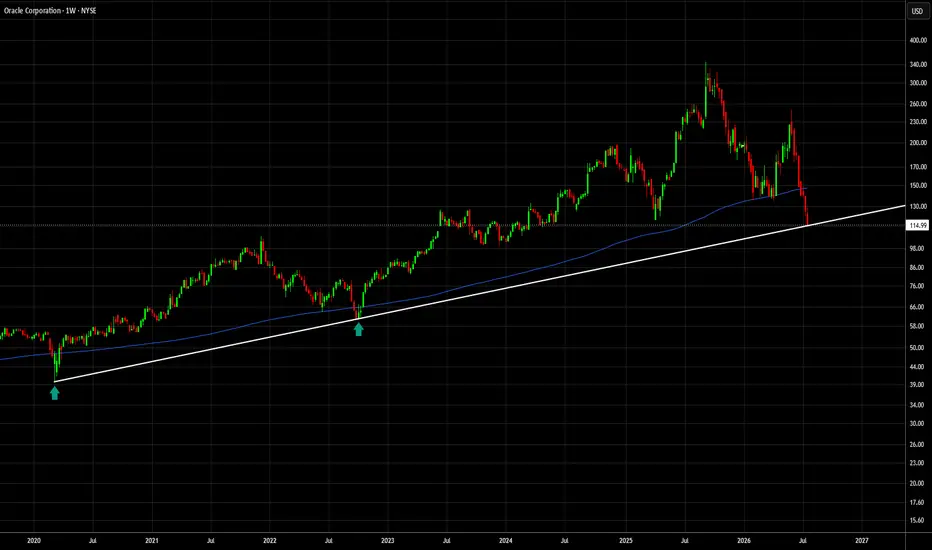
ORCL–High Conviction Bounce Setup At Long-Term SupportLooking at the weekly chart, NYSE:ORCL has just stopped right above a long-term trendline that has acted as major support twice before: during the March 2020 crash and again in October 2022. Both times, touching this trendline marked an important reversal point.
other thing that stands out is the 200-week moving average (blue line). Right now, the price is trading below it, but history suggests Oracle doesn't stay there for long.
Over the last 6 years, ORCL has broken below the 200-week movi
Reddit Below Both EMAs Ahead of Q2 EarningsExecutive Summary:
Reddit NYSE:RDDT fell 9.18% on July 23 after the Wall Street Journal reported the company is reconsidering its AI content licensing deal with Google
Shares are trading near $170, having broken below the 50-day EMA ($186.05) and 200-day EMA ($175.92), with a daily low of $166.13
14-day RSI sits near 31, close to oversold, while support levels stack at $166.10, $152.62, and $139.88
Wall Street's price target range is unusually wide, from $110 to $300, averaging around $221
GRND - 50 SMA Bounce and Big Cup & Handle💡 Swing setup idea
50 SMA support bounce
🔎 Analysis summary:
The stock is rising from the 50 SMA and looks to be closing a large cup and handle pattern. Buyers volume is also starting to pick up, but keep in mind the upcoming earnings report could add volatility.
👀 Levels to watch:
Entry trigger: Break above $16.55
Target: $22.99
Stop: Under the breakout level
💬 What do you think about this setup? Let me know in the comments! 👇
Good luck!
⚠️ Note: This is for educational purposes
GEN - 50 SMA Bounce and Big Cup & Handle💡 Swing setup idea
Big cup and handle pattern
🔎 Analysis summary:
The stock is bouncing off the 50 SMA and is closing a large cup and handle pattern. Buyers volume is also starting to warm up, which adds support to the setup.
👀 Levels to watch:
Entry trigger: Break above $28.15
Target: $38.17
Stop: Under the breakout level
💬 What do you think about this setup? Let me know in the comments! 👇
Good luck!
⚠️ Note: This is for educational purposes only and is not financial advice.
SOFI Channels Drive My Direction BiasAnd they lean bearish
SOFI lost the ascending channel and has failed multiple attempts to reclaim it. Every rejection has come on lower-than-average volume, which tells me buyers haven't shown enough conviction to regain acceptance inside the trend.
As long as price remains outside that channel, I have to respect the possibility that we're working toward the lower boundary of the larger macro channel.
The anchored VWAPs support that idea. They've consistently acted as areas where supply has
ONTO: Another Higher Low in the Making in this Bullish Cycle?ONTO continues to respect a textbook Higher High (HH) – Higher Low (HL) market structure, keeping its long-term uptrend firmly intact.
One characteristic has repeated throughout this rally:
Every new Higher High has been followed by a healthy pullback into either the Fibonacci Golden Pocket (61.8% retracement) or the Daily EMA89 (Weekly EMA20), before the next bullish leg begins.
The latest rally peaked around 386, and price has now corrected into the first high-probability support zone.
🟢 B
Nvidia: Is the Mothership Going Under?Nvidia has led the AI boom for more than three years, but some traders may think the mothership is going under.
The first pattern on today’s chart is the downward-sloping line along the highs of April and July. The lack of higher lows and higher highs may reflect a loss of momentum, especially after new highs in May and June failed to hold.
Second, prices are stalling under the 50-day simple moving average and failing to rally from the 200-day SMA. That also may show a fading trend.
Third, co