Long
Long
 Long
Long
 Long
Long
HOOD – PDT Dead. IPO Underwriter Approved. Insider Bought $20M.Four catalysts hit this stock in the last week and the chart is reacting. This isn't one piece of news moving the stock. This is a fundamental re-rating happening in real time.
Stop under the 9 EMA. Clean level to manage risk against.
─────────────────────────────────
WHAT JUST CHANGED
─────────────────────────────────
First — PDT rule is officially dead as of June 4. Robinhood is the direct primary beneficiary. Every retail trader with under $25,000 who was locked out of day trading can now trade freely through Robinhood's platform. That's tens of millions of newly unleashed accounts.
Second — CEO Vlad Tenev just announced Robinhood Securities received approval to underwrite IPOs. Not just distribute them — actually underwrite them alongside Goldman Sachs and Morgan Stanley. OpenAI, Anthropic, and SpaceX are all lined up to go public. Robinhood is positioning to be the underwriter that puts retail investors into those deals at IPO price. That's a completely new revenue stream that didn't exist a week ago.
Third — May metrics just dropped and they were strong. Platform assets hit $377 billion, up 48% year over year. Equity trading volumes up 75%. Options contracts up 29%. The engagement numbers are accelerating exactly when the business model is expanding.
Fourth — a director at Robinhood just purchased $20.18 million worth of HOOD shares on June 5. That's not a token insider buy. That's a board member putting real conviction money in right before multiple catalysts were about to hit.
Goldman Sachs raised their target to $108. Cantor Fitzgerald raised to $110. Deutsche Bank to $98. Multiple upgrades hitting in the same week the fundamentals are accelerating.
─────────────────────────────────
THE BIGGER PICTURE
─────────────────────────────────
Robinhood started as a app that let millennials buy fractional shares for free. That was the whole story for years. Now it's a full-service brokerage with banking, crypto, options, prediction markets, perpetual futures coming, and now IPO underwriting.
The PDT removal alone expands their total addressable market overnight. Every account that was handcuffed by the $25,000 rule just got unlocked and the first platform they're going to use more is the one already on their phone.
─────────────────────────────────
TRADE PLAN
─────────────────────────────────
Entry: Long on the setup
Stop: Under the 9 EMA
Catalysts: PDT removal, IPO underwriter approval, May metrics, insider buying
Analyst targets: $98 to $110 range across multiple upgrades this week
─────────────────────────────────
THE RISK
─────────────────────────────────
Robinhood is still fundamentally a cyclical business — when retail trading volumes drop and crypto goes quiet the revenue follows. Cathie Wood was selling today even as the stock ran. Market is extended and a broad pullback hits high-beta fintech names hard. Manage size and respect the 9 EMA stop.  Long
Long
Freeport Flirts with Record HighsFreeport-McMoRan has been challenging a long-term level, and some traders may think a breakout is coming.
The first pattern on today’s chart is the series of higher lows since mid-March, which may reveal buying pressure.
Second is the previous all-time high of $63.62 from 2008. The copper miner jumped to that price zone in late January and has pushed against it repeatedly since. Could it move through the resistance soon?
Third, the 50-day simple moving average (SMA) is near the 100-day SMA. That compression, with both rising, may create potential for a longer-term uptrend in FCX.
Fourth, Wilder’s Relative Strength Index (RSI) has been making higher lows.
Finally, the 8-day exponential moving average (EMA) is above the 21-day EMA. That could reflect a bullish short-term trend.
TradeStation has, for decades, advanced the trading industry, providing access to stocks, options and futures. If you're born to trade, we could be for you. Learn more here about TradingView’s Broker of the Year!
Past performance, whether actual or indicated by historical tests of strategies, is no guarantee of future performance or success. There is a possibility that you may sustain a loss equal to or greater than your entire investment regardless of which asset class you trade (equities, options or futures); therefore, you should not invest or risk money that you cannot afford to lose. Online trading is not suitable for all investors. View the document titled Characteristics and Risks of Standardized Options at www.TradeStation.com . Before trading any asset class, customers must read the relevant risk disclosure statements on www.TradeStation.com . System access and trade placement and execution may be delayed or fail due to market volatility and volume, quote delays, system and software errors, Internet traffic, outages and other factors.
Securities and futures trading is offered to self-directed customers by TradeStation Securities, Inc., a broker-dealer registered with the Securities and Exchange Commission and a futures commission merchant licensed with the Commodity Futures Trading Commission). TradeStation Securities is a member of the Financial Industry Regulatory Authority, the National Futures Association, and a number of exchanges.
TradeStation Securities, Inc. and TradeStation Technologies, Inc. are each wholly owned subsidiaries of TradeStation Group, Inc., both operating, and providing products and services, under the TradeStation brand and trademark. When applying for, or purchasing, accounts, subscriptions, products and services, it is important that you know which company you will be dealing with. Visit www.TradeStation.com for further important information explaining what this means.  Long
Long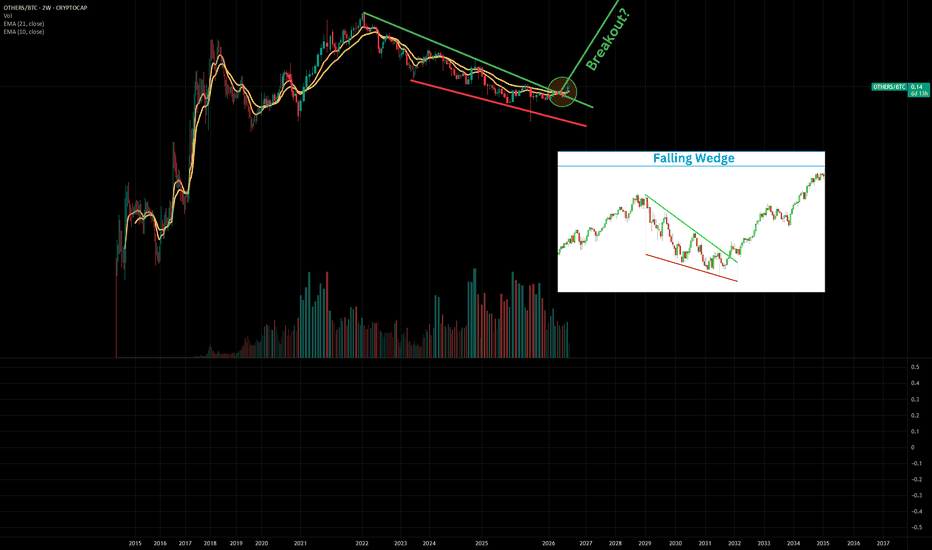
BTC Breaks Out on News — Now What?Hello everyone, friends 🌴
In my recent posts, I repeatedly highlighted that:
“62,500 remains the key level to watch. Holding it would open the road to 64,890.”
🎓 And that is exactly what happened. The 62,500 level held, and we first saw a purely technical move to 64,682, followed by a rally to 65,923, this time driven by the news flow.
I would especially point out that the price was able to break above 64,890 only thanks to the positive news surrounding the US and Iran.
❗️What matters most for the bulls right now is how price behaves at current levels. Will it be able to confidently break above the 100 EMA (4H), and how will it react as it approaches the upper boundary of the 64,890–67,600 range?
❌ At the moment, I do not see how a single positive news event can trigger a new BTC uptrend against the backdrop of an overall weak global technical structure.
It is definitely too early to celebrate, and it is extremely important to be cautious when adding long positions.
🔪🧨 THIS can be dumped back to 62,500 at any moment.
Peace! Brent's April 17 Low Is Back in PlayOur Brent crude contract is testing the April 17 low at $82.10, marking another occasion when we saw a raft of "Hormuz open" headlines, including from Donald Trump. If energy traders feel the latest MOU may actually lead to a lasting peace, you'd imagine the price would break beneath it.
Should we see a break and hold below $82.10, shorts could be set with a tight stop above for protection, targeting $80.20. That level acted as both support and resistance early in the conflict, ahead of the psychologically important $80 big figure. Beneath those levels, the 200-day moving average and the opening gap from the day before the war started at $73.55 are the next to watch.
Both RSI (14) and MACD are sending a uniformly bearish message. RSI is trending lower beneath 50 but is not yet oversold, while MACD is confirming the move, pushing further away from the signal line in negative territory.
If, for whatever reason, the price cannot sustainably break beneath $82.10 a barrel, the bearish bias would be invalidated.
Good luck!
DS  Short
Short
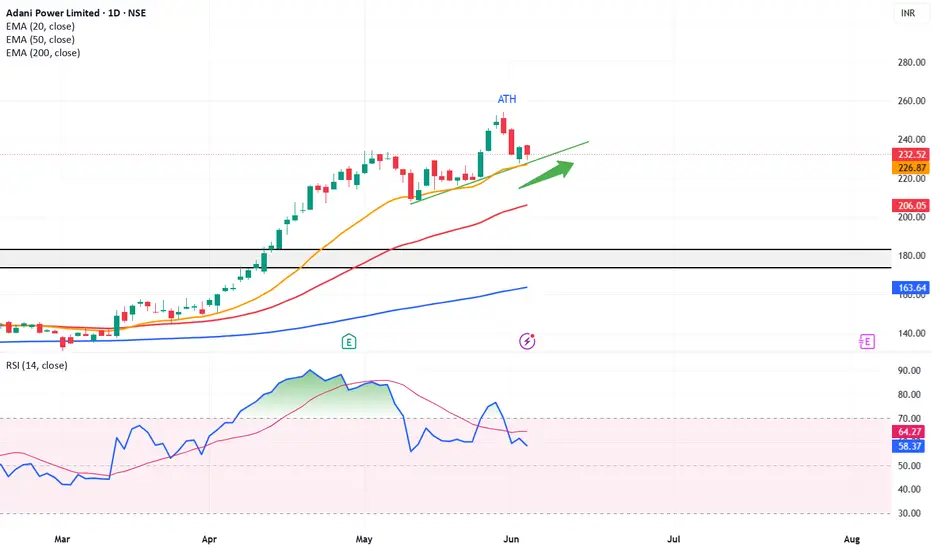
Adani Power Showing Signs of Strength After Key EMA BounceNSE:ADANIPOWER has recently found support near its 20-day EMA on the daily timeframe, indicating that the ongoing bullish trend remains intact and that the stock may be preparing for its next leg higher.
Adding to the positive setup, the sectoral benchmark, NSE:CNXENERGY , has also taken support at its 20-day EMA on the daily chart, providing further confirmation of strength across the energy sector and supporting the top-down approach .
The Weekly RSI (14) stands at 74.45, remaining above the 70 mark and reflecting strong bullish momentum. On the daily timeframe, the RSI has consistently found support around the 60 zone, suggesting a bullish range shift and reinforcing the prevailing uptrend. The stock is also trading at a rising short-term trendline support , which further strengthens the bullish structure.
Historically, the 20-day EMA has acted as a reliable dynamic support level for the stock , with previous pullbacks to this moving average often followed by fresh upward moves. In addition, the 20-day, 50-day, and 200-day EMAs continue to slope upward , highlighting the strength of the broader trend.
As long as the stock sustains above ₹225, NSE:ADANIPOWER could potentially retest its previous all-time high of ₹254.20 and extend the rally further. At the current price of ₹232.52, the setup offers an attractive reward-to-risk ratio of approximately 3:1 , with a stop-loss placed at ₹225 on daily closing basis and an initial upside objective near ₹252.
Key Support Levels: ₹229.50, ₹227, ₹225
Targets: ₹252, ₹260, ₹270
Disclaimer:
Investments in the securities market are subject to market risks, read all related documents carefully before investing. Securities quoted here are exemplary, not recommendatory. I am not a SEBI registered financial advisor, please consult your financial advisor before investing. Please note that I do not guarantee any assured returns for the securities quoted here.
Stay updated with my latest trading ideas and market analysis by following me on TradingView.
Hari Narayan N
Chartered Market Technician (CMT – All 3 Levels Cleared)  Long
Long
 Long
Long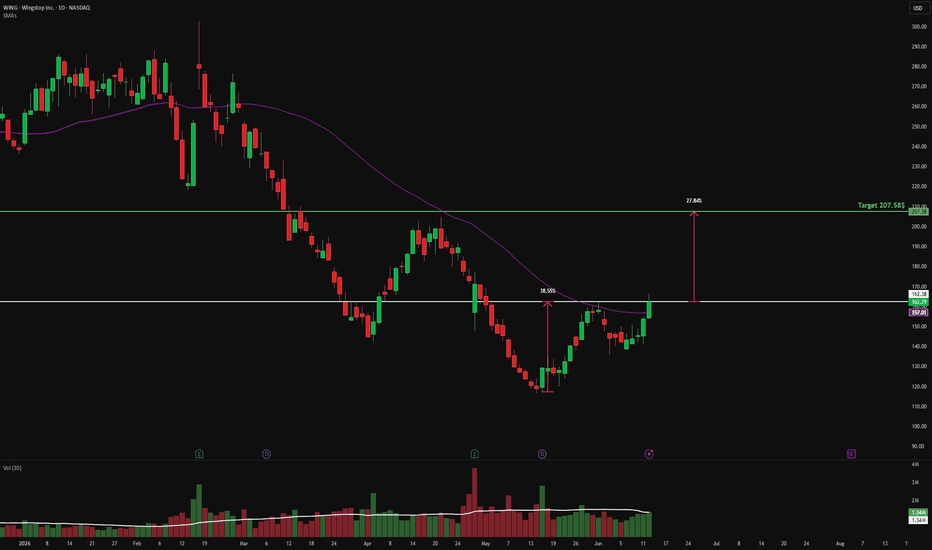
 Long
Long
Weekly Review - Internals Recover Before PriceTLDR:
The most important message from the dashboard is that internals improved faster than price. Leadership expanded, participation recovered and volatility normalized while price remains below recent highs. That combination suggests the market's internal condition is currently stronger than the recent price action alone would imply. The evidence therefore supports a regime of Acceptance with Renewed Participation, where market internals are once again confirming rather than questioning the message of price.
1️⃣ What do we see?
A week ago, the dashboard was raising legitimate questions about participation, leadership and volatility pressure.
Today, the picture looks very different.
The most important observation is not that price bounced. It is that the internal market structure improved significantly.
* VIX/VIX3M fell back to 0.86, indicating volatility normalization.
* S&P 500 stocks above SMA20 rose to 71%.
* S&P 500 stocks above SMA200 increased to 61%.
* NYSE New Highs expanded to 140 versus only 18 New Lows.
* NASDAQ New Highs expanded to 174 versus 91 New Lows.
* Advancing issues and advancing volume regained dominance across both exchanges.
Participation, leadership and breadth all improved simultaneously.
That combination is difficult to dismiss as a simple short-covering rally.
⸻
2️⃣ Thesis
The dashboard currently supports a view of Acceptance with Renewed Participation.
The recent selloff appears increasingly consistent with a rotation-induced shakeout rather than the beginning of a broad deterioration phase.
Leadership is expanding again.
Participation is broadening again.
Volatility pressure is easing again.
The market is not simply rising. The internal engine generating price has improved.
⸻
3️⃣ What validates the thesis?
The thesis remains valid if:
* VIX/VIX3M remains below 1.0 and continues normalizing.
* New Highs continue expanding relative to New Lows.
* % of stocks above SMA20 remains elevated or improves.
* % of stocks above SMA200 remains stable or trends higher.
* Advancing volume continues confirming price strength.
* Leadership remains broad across sectors rather than concentrated in a handful of names.
In that environment, internals continue confirming price.
⸻
4️⃣ What invalidates the thesis?
The thesis is invalidated if:
* VIX/VIX3M moves back toward or above 1.0.
* New Lows begin expanding materially.
* Leadership narrows again.
* % Above SMA20 rolls over sharply.
* Breadth weakens while price continues advancing.
That would indicate the recent improvement was temporary and that internal deterioration is re-emerging beneath the surface.
⸻
Why This Dashboard Matters
1. Reduction of Uncertainty / Confusion
Most market participants focus on the index and ask:
“Was the selloff meaningful?”
This dashboard asks a more useful question:
“Did market internals improve or deteriorate?”
Only a week ago, volatility pressure was rising, leadership was weakening and participation was becoming more selective. Today, those same indicators have improved materially. The framework allows us to observe that shift objectively rather than relying on opinions or emotions.
Instead of predicting the future, we measure whether the weight of evidence is strengthening or weakening.
I don’t need to know the future; I need to assess whether evidence is improving.
⸻
2. Reduction of Effort
Without a framework, every market move feels different.
With this dashboard, we repeatedly examine the same recurring conditions:
* Volatility
* Participation
* Leadership
* Breadth
* Volume confirmation
This week we did not need hundreds of charts to understand the market. By monitoring VIX/VIX3M, New Highs versus New Lows, % Above SMA20, % Above SMA200 and Up/Down Volume, the market’s internal condition became clear.
The framework converts complexity into a small number of repeatable observations.
I don’t need to analyze everything; I need to recognize a handful of recurring conditions.
⸻
3. Identity Reinforcement
The objective is not to predict whether the market will be higher or lower next week.
The objective is to follow evidence.
A week ago, the dashboard suggested caution because participation was weakening and volatility pressure was rising. Today, the same framework identifies improving breadth, expanding leadership and normalized volatility.
The process did not change.
The evidence changed.
That is how disciplined investors operate. They adapt when evidence changes rather than defend opinions.
I am a process-driven investor, not a prediction-driven investor. XAUUSD — EMA Bearish Trend, Sell From Fibonacci Value Zone
Fundamental Analysis
Gold remains under bearish pressure as the market focuses on key USD events this week, including the Federal Funds Rate, FOMC Economic Projections, FOMC Statement, and the FOMC Press Conference.
These events may create strong volatility for XAUUSD. If the Fed tone supports USD strength or keeps rate expectations tight, gold may continue to face selling pressure on recovery attempts.
Technical Analysis
On the 4H chart, XAUUSD is still moving inside a descending channel. EMA 34, EMA 89, and EMA 200 remain above price, confirming that the main trend is still bearish.
Price is currently trading around 4,218 after a short-term recovery from the lower area. However, this bounce is moving toward the Fibonacci value zone and EMA resistance area around 4,240 - 4,280.
This zone is important because it aligns with the 0.236 - 0.382 Fibonacci retracement, the EMA range, previous broken structure, and channel pressure. If price rejects from this area, sellers may regain control.
The key bearish confirmation level is 4,170. A clean break below this level would strengthen the downside continuation toward 4,026. If bearish momentum expands further, the weekly goal remains the Fibonacci Extension 1.618 zone around 3,813 - 3,815.
Important Key Levels
Current price area: 4,218
Fibonacci value sell zone: 4,240 - 4,280
EMA sell range: 4,240 - 4,280
Short-term resistance: 4,239 - 4,281
Key bearish confirmation level: 4,170
Reaction support: 4,026
Weekly Fibonacci Extension target: 3,813 - 3,815
Invalidation area: above 4,370
Trading Scenario
Main Sell Scenario
Entry: 4,240 - 4,280
Stop Loss: 4,370
Take Profit 1: 4,170
Take Profit 2: 4,026
Take Profit 3: 3,813 - 3,815
Sell Condition
The preferred setup is to wait for gold to pull back into the 4,240 - 4,280 Fibonacci value zone. This area aligns with the EMA sell range, descending channel pressure, and previous broken structure.
A sell setup becomes more valid if price forms bearish rejection from this zone, such as a long upper wick, bearish engulfing candle, failed breakout, or lower high below the EMA structure.
If price rejects from the sell zone and breaks below 4,170, the bearish continuation view becomes stronger. The next reaction level is 4,026, followed by the weekly Fibonacci Extension target around 3,813 - 3,815.
Entry Conditions
Wait for price to retest 4,240 - 4,280.
Look for bearish rejection before entering sell.
A break below 4,170 confirms stronger bearish pressure.
Be careful with FOMC volatility this week.
If price breaks and holds above 4,370, the sell setup is invalid.
Overall, the main view remains bearish while XAUUSD trades below the EMA structure and inside the descending channel. The preferred plan is to wait for a pullback into the Fibonacci value zone, then look for sell confirmation toward 4,170, 4,026, and the weekly Fibonacci Extension zone around 3,813 - 3,815.
Do you share the same bearish view on gold, or are you waiting for FOMC confirmation before taking a position?
 Short
Short
 Long
Long
Adobe (Revised) | ADBE | Long at $201.76This is a revised analysis of Adobe NASDAQ:ADBE from:
**Full disclosure: I am still and holder at $347.44 and adding heavily in the $100-$200 range. Should have been more patient here with entry.
TECHNICAL ANALYSIS
Price entered my selected "crash" simple moving average area (green lines). This area is often, but not always, a zone of algorithmic buying.
If price significantly falls though the "crash" level, next support area is at the gray lines (or my "major crash" simple moving average zone). This area, currently between $134 and $156, is another personal buying opportunity for a much stronger position. I think there is a good probability it could close the open price gap near $124 if news stays negative.
INSIDERS
Lots of selling: openinsider.com
GROWTH
EPS anticipated to rise 54.5% from $20.9 billion in 2025 to $32.3 billion by 2029.
Revenue anticipated to rise 44.4% from $23.8 billion in 2025 to $34.4 billion by 2029.
ACTION
A strong company and brand that must adopt to a changing AI-led landscape. Despite future growth, strong cash flow, and dominance in its space, it's simply going through downturn. I am confident the price will rebound; it's just a matter of when. Thus, at $201.76, NASDAQ:ADBE is in a personal buy zone with potentially continued decline into the "major crash" simple moving average area. That zone, if reached, will be an area of personal heavy share accumulation.
TARGETS INTO 2029
$240.00 (+19.0%)
$285.00 (+41.3%)
If you enjoyed this idea, please consider following for more: www.tradingview.com  Long
Long
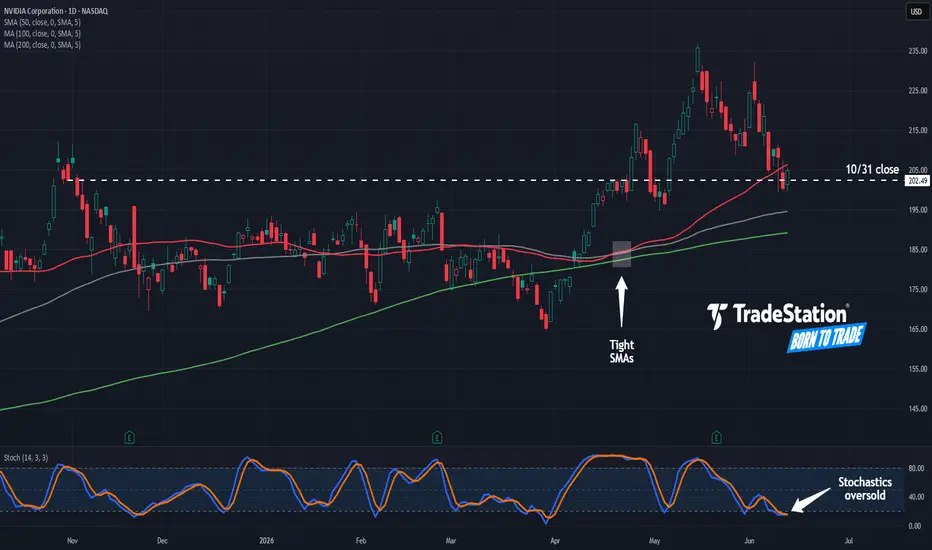
Nvidia Holds Old HighsNvidia has retreated from record territory in mid-May, but some traders may see an opportunity in the pullback.
The first pattern on today’s chart is the $202.49 level, an earlier record weekly closing price from October 31. The chip giant is apparently stabilizing around that old peak. Has old resistance become new support?
Second, the 50-day simple moving average (SMA) recently compressed near the 100- and 200-day SMAs. They’re now expanding away from each other, with the faster SMAs above the slower. That may reflect the beginning of a longer-term uptrend.
Next, stochastics have been mired in oversold territory.
Finally, NVDA is a highly active underlier in the options market. (Its average daily volume of 2.5 million contracts ranks first in the S&P 500, according to TradeStation data.) That could help traders take positions with calls and puts.
TradeStation has, for decades, advanced the trading industry, providing access to stocks, options and futures. If you're born to trade, we could be for you. Learn more here about TradingView’s Broker of the Year!
Past performance, whether actual or indicated by historical tests of strategies, is no guarantee of future performance or success. There is a possibility that you may sustain a loss equal to or greater than your entire investment regardless of which asset class you trade (equities, options or futures); therefore, you should not invest or risk money that you cannot afford to lose. Online trading is not suitable for all investors. View the document titled Characteristics and Risks of Standardized Options at www.TradeStation.com . Before trading any asset class, customers must read the relevant risk disclosure statements on www.TradeStation.com . System access and trade placement and execution may be delayed or fail due to market volatility and volume, quote delays, system and software errors, Internet traffic, outages and other factors.
Securities and futures trading is offered to self-directed customers by TradeStation Securities, Inc., a broker-dealer registered with the Securities and Exchange Commission and a futures commission merchant licensed with the Commodity Futures Trading Commission). TradeStation Securities is a member of the Financial Industry Regulatory Authority, the National Futures Association, and a number of exchanges.
TradeStation Securities, Inc. and TradeStation Technologies, Inc. are each wholly owned subsidiaries of TradeStation Group, Inc., both operating, and providing products and services, under the TradeStation brand and trademark. When applying for, or purchasing, accounts, subscriptions, products and services, it is important that you know which company you will be dealing with. Visit www.TradeStation.com for further important information explaining what this means.  Long
Long
 Long
Long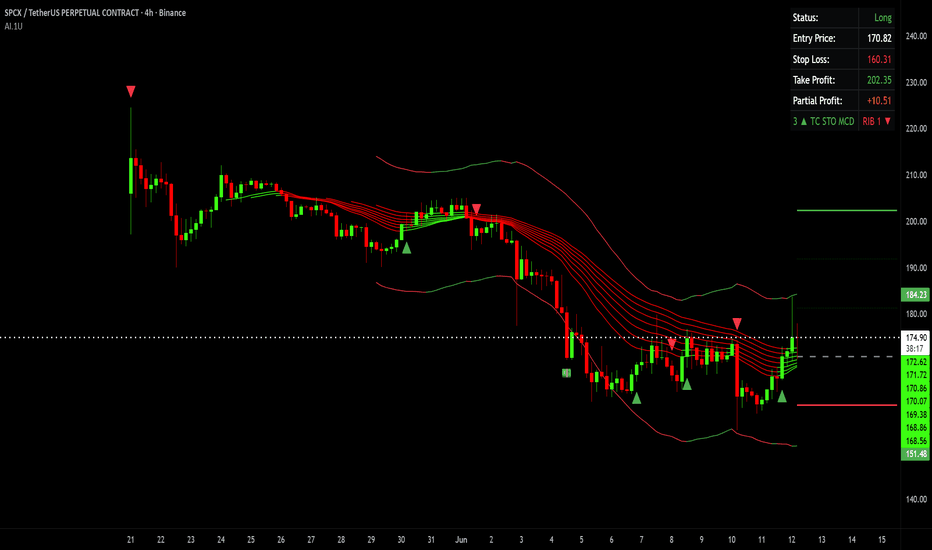
XAUUSD — Sell Below EMA Trend From Liquidity Resistance
Fundamental Analysis
Gold remains under pressure as the market continues to watch USD strength, Treasury yields, and upcoming U.S. data. The current structure still favours sellers while price trades below the main EMA resistance.
For now, any recovery should be treated as a technical pullback unless gold can reclaim the key resistance zone with strong confirmation.
Technical Analysis
On the 1H chart, XAUUSD is still trading below EMA 34, EMA 89, and EMA 200. This shows that the short-term trend remains bearish, with the EMA structure acting as dynamic resistance above price.
Price is also moving inside a descending channel. After the previous bullish reaction from the lower area, gold is now slowing below the EMA zone again, which means sellers may still control the structure.
The key sell area is around 4,249 - 4,283. This zone is important because it combines the previous key support zone, liquidity resistance, and the upper reaction area below EMA pressure. If price retests this area and rejects, the bearish continuation setup becomes cleaner.
Below current price, the next liquidity zone is around 4,055 - 4,065. If sellers break this area, the next downside target may extend toward 4,024 and then 3,953.
Important Key Levels
Current price area: 4,178
Main sell zone: 4,249 - 4,283
Key support turned resistance: 4,249 - 4,283
EMA resistance area: 4,205 - 4,300
Nearest liquidity target: 4,055 - 4,065
Key downside level: 4,024
Extended bearish target: 3,953
Invalidation area: above 4,300
Trading Scenario
Main Sell Scenario
Entry: 4,249 - 4,283
Stop Loss: 4,300
Take Profit 1: 4,055
Take Profit 2: 4,024
Take Profit 3: 3,953
Sell Condition
The preferred setup is to wait for gold to retest the 4,249 - 4,283 resistance zone. This is the main liquidity sell area on the chart and also aligns with the broken support structure.
A sell setup becomes more valid if price forms bearish rejection from this zone, such as a long upper wick, bearish engulfing candle, failed breakout, or lower high below the EMA structure.
If price rejects from the sell zone and breaks below 4,159 - 4,150, the bearish continuation view becomes stronger. The next downside focus would be 4,055 - 4,065, followed by 4,024 and 3,953.
Entry Conditions
Wait for price to retest 4,249 - 4,283.
Look for bearish rejection before entering sell.
Do not sell directly at the lows without a pullback.
If price breaks and holds above 4,300, the sell setup is invalid.
Overall, the main view remains bearish while XAUUSD trades below the EMA structure and inside the descending channel. The preferred plan is to wait for price to retest the 4,249 - 4,283 liquidity resistance zone, then look for sell confirmation toward 4,055, 4,024, and 3,953.
Do you share the same bearish view on gold, or are you waiting for a cleaner retest of the sell zone first?
Short 
ASX 200 Break Above 8811 Could Open the Door to 8900Our ASX 200 contract is testing the recent range highs at 8811 on the H4 timeframe, with the initial probe ending in failure. However, the price continues to sit above the 100 and 200-day moving averages on the daily chart on the right, a zone it has struggled to hold above in the recent past. As such, given where our ASX 200 contract now trades, we have some levels to build trade setups around.
If the price can push above the current range high at 8811 and hold there, longs could be considered targeting 8900, a level that has acted as both support and resistance at various points this year. A stop beneath 8811 would offer protection against reversal. Right now, the message from RSI (14) and MACD on the H4 favours longs over shorts, with upside momentum continuing to build.
However, given the initial reluctance to break the range, and the history around these levels, shorts cannot be discounted entirely. Should the price reverse and close beneath the lower end of the moving average zone at 8778.5, shorts could be considered with a stop above the upper end of the zone at 8784.8, targeting 8700, which briefly capped the price earlier this week. 8547 looms as another target, marking the low hit on Thursday prior to the latest bout of Iran-US peace deal hopes.
Good luck!
DS Long 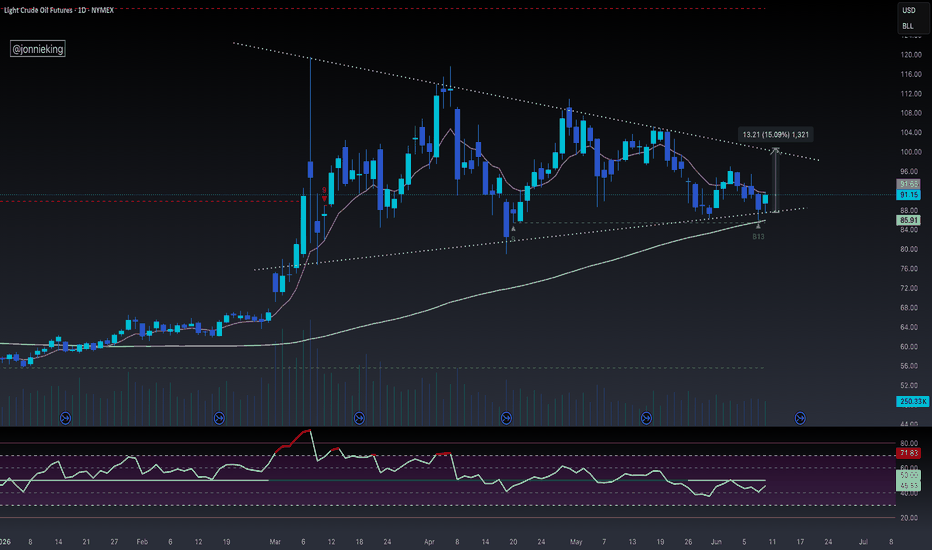
 Long
Long