Wave (IV) Correction or the Beginning of a Larger Degree Wave II# BNB Daily Chart: Wave (IV) Correction or the Beginning of a Larger Degree Wave II?
Following the two primary scenarios presented on the weekly chart, the daily timeframe provides a clearer perspective on the current corrective structure developing in BNB.
## Aggressive Scenario: Development of Wave (IV)
Under the aggressive Elliott Wave interpretation, the decline from the recent high is considered part of an ongoing **wave (IV)** correction following the completion of wave **(III)**. The proportional relationship between the previous impulsive waves continues to support this interpretation.
At present, wave (IV) appears to be evolving as a **complex double zigzag correction (W-X-Y)**. The recent breakdown below the terminal channel reinforces the possibility that the correction has not yet been completed and may continue toward deeper Fibonacci retracement levels before establishing a significant bottom.
If this scenario remains valid, the completion of wave (IV) would pave the way for the beginning of **wave (V)**. Historically, final impulsive waves within mature bullish cycles can become highly extended, suggesting that the next upward expansion may exceed the magnitude of both previous impulsive advances.
## Conservative Scenario: The Beginning of a Larger Corrective Cycle
The conservative interpretation continues to favor the existence of two completed **1-2 and 1-2 sequences**, implying that the market is developing a larger degree **(I)-(II)** structure.
From this perspective, the current decline may represent only the initial phase of a larger corrective process. The ongoing decline from the all-time high would therefore be labeled as **wave A**, which could later be followed by a corrective **wave B** rally and a subsequent **wave C** decline to complete the larger degree **wave II** correction.
This interpretation allows for a substantially larger corrective structure, potentially developing either as a multiple zigzag formation or as a broader zigzag correction spanning several market cycles.
## Key Observation
The breakdown of the terminal channel and the current price behavior suggest that the market remains in a corrective environment. However, whether this correction belongs to a developing **wave (IV)** or to a much larger degree **wave II** remains the critical question.
As always, Elliott Wave analysis is not about predicting a predetermined future. It is about recognizing the structure the market chooses to reveal and adapting as evidence unfolds.
**Sometimes the market whispers two different futures at the same time. The challenge is learning which whisper becomes reality.**
– Patterns whisper. I listen. – Mr. Nobody 🎧📊
Binance Coin
1 hour ago
# BNB: When Two Cycles Whisper Different Futures
 Short
Short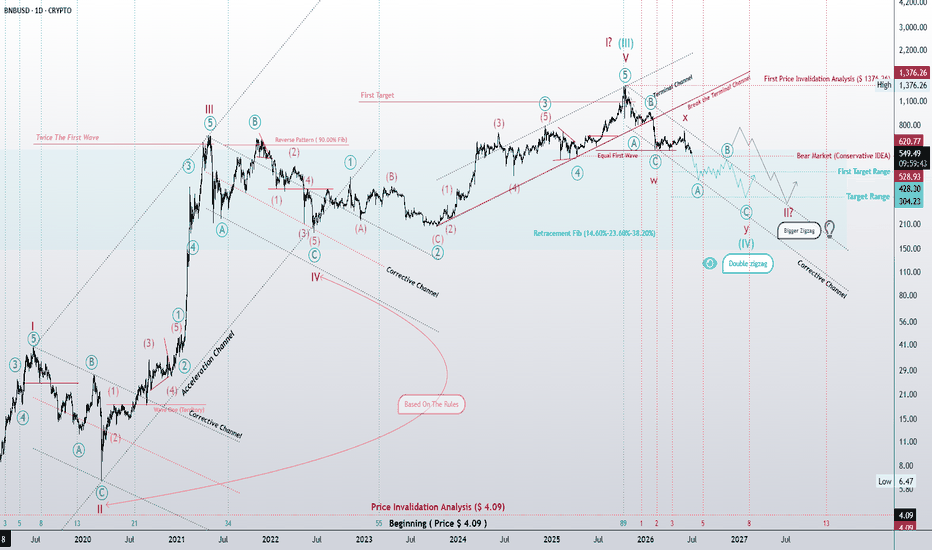
 Short
Short
# BNB: When Two Cycles Whisper Different Futures # BNB: When Two Cycles Whisper Different Futures | Elliott Wave Weekly Analysis
The current BNB weekly structure presents two valid Elliott Wave interpretations, each suggesting a significantly different long-term path while remaining fully consistent with Elliott Wave principles.
### Aggressive Scenario: Wave (IV) in Progress
Under the aggressive interpretation, the recent decline is viewed as the development of **wave (IV)** following the completion of **wave (III)**. One of the strongest arguments supporting this scenario is the proportional relationship between **waves (I) and (III)**, which often serves as an important guideline for identifying impulsive structures.
If this count proves correct, the market is currently developing a deep corrective phase that may evolve into a **multiple zigzag correction**. Such corrections frequently extend further than initially anticipated before exhausting themselves near key structural and Fibonacci support zones.
Upon completion of wave (IV), the market would be expected to begin **wave (V)**. Given the characteristics of late-stage bullish cycles, there remains a strong possibility that wave (V) could extend beyond the magnitude of both previous impulsive waves, creating a final expansion phase before the completion of the larger degree cycle.
### Conservative Scenario: Nested 1-2 Structures
The conservative interpretation proposes a more complex but equally valid Elliott Wave structure. In this scenario, the market has already completed two consecutive **1-2 and 1-2 cycles**, effectively forming two complete eight-wave sequences across multiple degrees.
Under this interpretation, BNB is currently developing a larger degree **(I)-(II)** cycle while simultaneously completing a secondary **I-II** sequence. The ongoing correction may therefore evolve either as a **multiple zigzag structure** or as part of a much larger corrective zigzag formation.
From this perspective, the decline from the all-time high to current market levels would represent only **wave A** of the larger correction. This would eventually be followed by a counter-trend **wave B** rally and a final **wave C** decline, completing the larger degree **wave II** correction before the next major impulsive cycle begins.
### Final Thoughts
At this stage, both scenarios remain technically valid within the Elliott Wave framework. The aggressive scenario anticipates the completion of a major fourth wave before a final bullish expansion, while the conservative scenario suggests that the market is still engaged in building a much larger corrective structure.
As always, the objective is not to predict what the market must do, but to identify the patterns it is currently revealing and adapt as new information emerges.
**The market never speaks loudly. It whispers through patterns.**
– Patterns whisper. I listen. – Mr. Nobody 🎧📊
Long 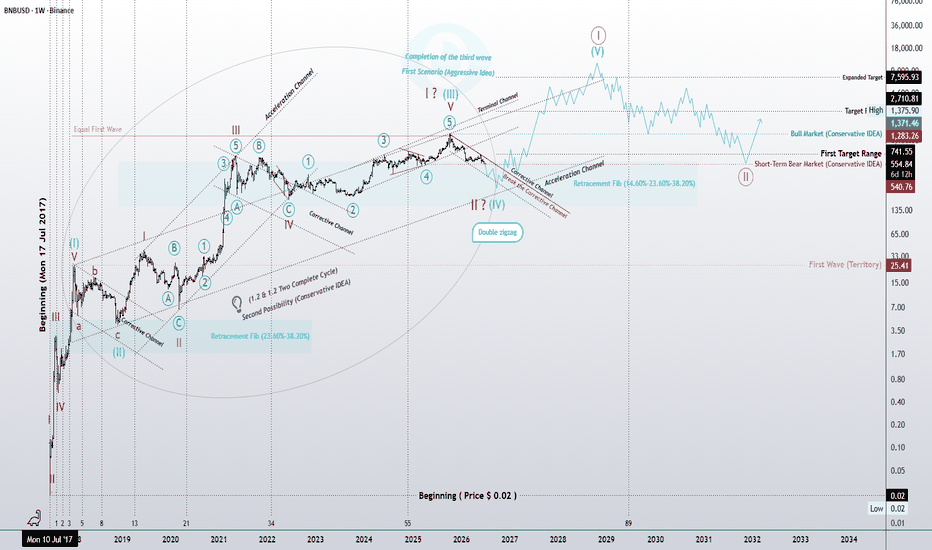
XAU/USD 29 June 2026 Intraday AnalysisH4 Analysis:
-> Swing: Bullish.
-> Internal: Bearish.
Bias and analysis to remain the same as analysis dated 25 June 2026.
Price has printed according to my analysis dated 15 June 2026 with price subsequently printing a bearish iBOS.
Price is currently trading within an internal high and fractal low. CHoCH positioning is denoted with a blue dotted horizontal line.
Intraday expectation:
Price to print bullish CHoCH to indicate bullish pullback phase initiation.
Note:
Gold remains volatile as tensions between the US, Israel, and Iran keep safe‑haven demand elevated.
Markets are reacting quickly to every headline, while uncertainty around the Fed’s easing path and shifting U.S. policy under President Trump, especially tariffs continues to fuel choppy price action.
For newer traders, the key is simple, stay flexible and manage risk carefully, as fast spikes and sudden reversals are a normal part of the current XAU/USD environment.
H4 Chart:
M15 Analysis:
-> Swing: Bearish.
-> Internal: Bearish.
Bias and analysis to remain the same as analysis dated 25 June 2026.
As mentioned in my analysis dated 15 June 2026 where I was not convinced of the insignificant nature of the bullish iBOS. I also mentioned in alternative scenario of my analysis that I would not be surprised to see price print a bearish iBOS by targeting strong internal low, priced at 4,023.870.
This is how priced printed, subsequently printing a bearish iBOS.
Price is currently trading within an internal high and fractal low. CHoCH positioning is denoted with a blue dotted horizontal line.
Intraday expectation:
Price to print bullish CHoCH to indicate bullish pullback phase, thereafter, price to trade up to either premium of internal 50% EQ, or M15 demand zone before targeting weak internal low, currently priced at 3,959.080.
Note:
Gold remains highly reactive on M15 as geopolitical risk continues to drive quick, headline‑led moves.
The tension between the US, Israel, and Iran is keeping safe‑haven demand elevated, with markets still sensitive to any sign of escalation.
At the same time, shifting US tariff policy under President Trump is adding extra uncertainty, fuelling sharp intraday swings and increasing the likelihood of sudden sentiment flips. Liquidity pockets and whipsaws remain common, making disciplined risk management essential.
Gold’s geopolitical premium is still firmly in place, and until tensions ease, short‑term volatility is likely to stay front‑loaded.
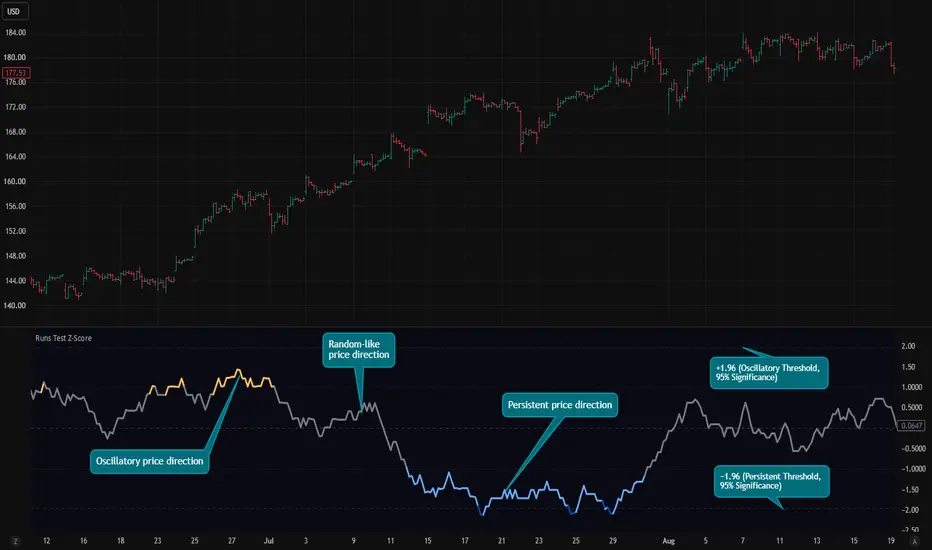
M15 Chart: Randomness in Sequential Price DirectionFigure 1. Example of Runs Test Z-score classifications. Grey regions indicate statistically Random-Like directional sequences, blue regions indicate Persistent directional behavior, and orange regions indicate Oscillatory (alternating) directional behavior.
## Objective
An investigation was conducted to evaluate whether sequential **price direction** is governed by a random process. Specifically, directional price sequences were tested for randomness across **Daily, 4-hour, 1-hour, and 30-minute** timeframes. In addition, a robustness study was conducted to determine whether the results remained stable across Runs Test lookback windows of **30, 60, and 100 bars**.
Randomness was evaluated using the **Wald–Wolfowitz Runs Test Z-Score** applied to rolling windows of close-to-close directional price changes.
The objective of this study was **not** to predict future returns, but rather to quantify the statistical structure of directional price sequences.
---
# Data
The study consisted primarily of large-cap U.S. equities drawn from the S&P 100 and spanning multiple industry sectors.
Two complementary datasets were analyzed.
### Timeframe Study
* 107 U.S. equities
* Daily, 4-hour, 1-hour, and 30-minute charts
* Analysis period: **January 2020 – March 2026**
**107 stocks × 4 timeframes = 428 independent price series**
### Lookback Robustness Study
* 50 U.S. equities
* Daily, 4-hour, 1-hour, and 30-minute charts
* Runs Test lookback windows:
* 30 bars
* 60 bars
* 100 bars
**50 stocks × 4 timeframes × 3 lookbacks = 600 independent configurations**
---
# Runs Test Z-Score Classification
For every rolling window, the Runs Test Z-Score was calculated using close-to-close directional price changes and classified as follows.
| State | Condition |
| :---------- | :--------------- |
| Persistent | Z < -1.96 |
| Random-Like | -1.96 ≤ Z ≤ 1.96 |
| Oscillatory | Z > +1.96 |
For every stock, timeframe, and lookback window, the percentage of rolling windows falling into each classification was calculated.
---
# Statistical Framework
The primary endpoint was the **Random-Like percentage**.
The following statistical procedures were applied:
1. Friedman Test (repeated-measures comparison across timeframes and lookback periods)
2. Kendall's W (effect size)
3. Wilcoxon Signed-Rank Tests with Holm correction (post-hoc comparisons)
4. Page Trend Test for the ordered hypotheses:
```
Daily < 4-hour < 1-hour < 30-minute
30-bar > 60-bar > 100-bar
```
---
# Primary Findings
**Across all securities, timeframes, and lookback windows, approximately 95% of rolling windows were classified as Random-Like by the Wald–Wolfowitz Runs Test.**
This remarkable level of stability persisted across every configuration examined.
---
## Timeframe Study (107 Stocks)
Median Random-Like percentages were:
| Timeframe | Random-Like (%) |
| :-------- | --------------: |
| Daily | 95.21 |
| 4-hour | 95.10 |
| 1-hour | 95.14 |
| 30-minute | 94.99 |
**Range across all four timeframes:** **0.22 percentage points**
Despite analyzing more than four hundred independent price series, the measured level of directional randomness remained essentially unchanged across observation frequencies.
---
## Lookback Robustness Study (50 Stocks)
Changing the Runs Test lookback window from 30 to 60 and 100 bars produced similarly small changes.
| Lookback | Mean Random-Like (%) |
| :------- | -------------------: |
| 30 | 94.77 |
| 60 | 94.04 |
| 100 | 93.34 |
**Total change:** **1.43 percentage points**
Even the largest observed difference represented less than a **2% absolute change** in Random-Like classification.
Across all tested configurations, Random-Like classifications consistently remained close to 95%.
---
# Statistical Confirmation
Repeated-measures statistical testing confirmed that these small numerical differences rarely translated into meaningful practical effects.
## Timeframe Study
**Zero-Split Partition**
* Friedman χ² = 3.056
* p = 0.383
* Kendall's W = 0.0095
Kendall's W indicates a **negligible effect size**, demonstrating that differences between timeframes were statistically trivial.
The Page Trend Test found **no evidence** that directional randomness increases monotonically as timeframe decreases.
---
## Lookback Robustness
Across all four timeframes, the largest observed effect size was:
**Kendall's W = 0.281**
Most comparisons produced considerably smaller effect sizes.
These results indicate that increasing the Runs Test lookback window from 30 to 100 bars produces only minor changes in classification percentages.
---
## Summary Results
### Daily
| Lookback | Persistent % | Random-Like % | Oscillatory % |
|---|---:|---:|---:|
| 30 | 2.36 | **94.77** | 2.87 |
| 60 | 2.54 | **94.04** | 3.42 |
| 100 | 2.33 | **93.34** | 4.33 |
### 4-Hour
| Lookback | Persistent % | Random-Like % | Oscillatory % |
|---|---:|---:|---:|
| 30 | 1.96 | **95.31** | 2.73 |
| 60 | 1.78 | **95.27** | 2.95 |
| 100 | 1.61 | **94.79** | 3.60 |
### 1-Hour
| Lookback | Persistent % | Random-Like % | Oscillatory % |
|---|---:|---:|---:|
| 30 | 2.47 | **95.17** | 2.36 |
| 60 | 2.42 | **95.11** | 2.46 |
| 100 | 2.43 | **95.15** | 2.42 |
### 30-Minute
| Lookback | Persistent % | Random-Like % | Oscillatory % |
|---|---:|---:|---:|
| 30 | 2.53 | **95.04** | 2.43 |
| 60 | 2.38 | **94.90** | 2.71 |
| 100 | 2.38 | **94.75** | 2.87 |
**P = Persistent R = Random-Like O = Oscillatory**
The 100-bar Daily configuration exhibited a modestly lower Random-Like percentage (93.3%) and a correspondingly higher Oscillatory classification (4.3%). Although this suggests slightly more detectable directional structure at longer observation windows, the dominant classification remained overwhelmingly Random-Like.
---
# Conclusions
The combined studies produced one clear empirical result.
**Across all datasets, approximately 95% of rolling windows were classified as Random-Like by the Wald–Wolfowitz Runs Test, regardless of whether prices were sampled on Daily, 4-hour, 1-hour, or 30-minute charts.**
Furthermore, this conclusion remained remarkably stable across Runs Test lookback windows of **30, 60, and 100 bars**.
---
# Key Takeaways
## 1. Directional price sequences are overwhelmingly Random-Like
Approximately **95%** of all rolling windows were classified as Random-Like regardless of timeframe or lookback window.
**Implication**
Trading methodologies that rely primarily on directional price sequences are operating in a domain that was statistically indistinguishable from randomness for approximately 95% of the rolling windows examined. Visual chart patterns such as flags, engulfing candles, and morning stars therefore require rigorous out-of-sample validation before being considered evidence of a genuine trading edge.
---
## 2. Timeframe has little influence on directional randomness
The hypothesized Adaptive Market Hypothesis ordering—that lower timeframes would exhibit progressively greater randomness—was not supported.
Random-Like classifications remained remarkably uniform across all timeframes.
**Implication**
Changing chart timeframe is unlikely to reduce directional randomness. A trader moving from Daily to 30-minute charts should not expect materially different directional behavior.
---
## 3. Most of the informative structure resides in the minority tail states
Persistent and Oscillatory classifications together accounted for only about **5%** of all rolling windows.
These are the only regions where the Runs Test rejects the null hypothesis of randomness, indicating statistically detectable departures from random directional sequencing.
**Implication**
For quantitative traders using regime filters, the Random-Like state may be viewed as a reduced-confidence environment, while Persistent and Oscillatory classifications deserve greater analytical attention.
---
## 4. Longer lookback windows show a modest increase in Oscillatory classifications
At the 100-bar lookback, Oscillatory classifications increased modestly, particularly on Daily and 4-hour charts.
**Implication**
Whether this behavior reflects exploitable mean-reverting dynamics requires separate predictive validation. The Runs Test alone cannot establish predictive trading value.
---
## 5. Candlestick and price-action methodologies warrant independent statistical validation
Many candlestick and price-action methodologies derive their signals from directional price sequences—the same domain found to be Random-Like for approximately **95%** of the rolling windows analyzed.
**Implication**
Pattern recognition alone should not be regarded as sufficient evidence of predictive power. Any claimed trading edge should be demonstrated through independent statistical testing against an appropriate randomness baseline.
---
# Conclusion
This study suggests that **directional sign information alone contains limited statistical structure across standard trading timeframes.**
Future research may therefore benefit from incorporating additional information beyond directional sign, including return magnitude, volatility, trading volume, or cross-asset relationships, which may contain structural information not captured by directional sequencing alone.
## What This Study Does Not Say
To prevent a common misinterpretation, a 95% Random-Like classification does **not** mean that profitable trading is impossible, nor does it imply that markets are informationally efficient.
It means only that the raw sequence of positive and negative price changes—the ordering of green and red bars—contains **limited statistical information when considered in isolation**. A directional sequence that appears random under the Runs Test can still coexist with genuine market inefficiencies. This study does not rule out profitability; rather, it suggests that **directional sign alone is unlikely to be a sufficient source of trading edge**.
Nor does it dismiss the importance of return magnitude. A price series can exhibit near-random directional sequencing while remaining highly structured in the size of its price movements. Trend-following strategies that capture relatively rare but outsized moves, and mean-reversion strategies that exploit predictable volatility behavior, may retain a durable edge even when the sequence of winning and losing trades resembles a coin flip.
Likewise, this study does not dismiss non-price information. Trading volume, order flow, liquidity conditions, macroeconomic influences, and cross-asset relationships may all contain structural information that binary directional sign analysis intentionally ignores.
Finally, the approximately 5% of windows classified as Persistent or Oscillatory should not be viewed as trivial. In quantitative finance, relatively small statistical edges can have meaningful practical value when exploited consistently. Casinos operate on a house edge of 1–5% depending on the game, and generate consistent, predictable, compounding revenue.**If an algorithm can reliably identify these departures from randomness in real time, they may represent informative market regimes worthy of further investigation.**

 Short
Short
Short 
Ethereum to $800 - The Inevitable Breakdown - June 2026
SYMBOL: COINBASE:ETHUSD | DIRECTION: SHORT | TIMEFRAME: 2-Month
Published: June 2026
Ethereum is different. You’ve heard, presumably. Ultrasound money. EIP-1559. The merge. Proof of stake. Deflationary tokenomics. The base layer for the decentralised financial system. The flippening. Staking yields. The whole internet of value.
These arguments have been present and passionately delivered for approximately every single moment of ETH’s decline from $4,900 to the current price. They will still be present at $800. They were also present at the 2022 low of $880 and at the 2018 low of $80. The arguments do not change, but the price does.
Let us examine what the 2-month chart is actually saying, while the Telegram group is sharing rocket emojis.
On the above 2-month chart a bear flag has confirmed (see 6 and 9 week charts), a measured move of -80.86% targets $800, and RSI has broken below 47 for the first time in Ethereum’s listed history. A number of reasons now exist to expect significantly further downside. They include:
1) Bear flag confirmed. Bear flags are not complicated. Price makes a sharp leg down, consolidates in an upward-sloping channel that feels like a recovery (it is not a recovery), then breaks lower and travels the distance of the original leg. This one confirmed on June 9th.
The measured move projects a decline of 80.86% from the breakdown point, targeting $800. A target Ww forecast back in 2023 that is taking longer than the heat death of the universe to realise. It seems I forget people actually do believe Raoul Pal's real vision price predictions.
For context: ETH fell 82% in 2022. It fell 94% in 2018. This would be the third time the same percentage drawdown has occurred in the same asset with the same community explaining why it won’t. It is, genuinely, almost impressive.
2) RSI below 47 on the 2-month chart - a first in ETH’s history. In the entire listed history of Ethereum, RSI on the 2-month chart has never closed below 47. Not in 2018 when the asset fell 94%. Not during the COVID collapse of 2020. Not in the 2022 bear market. Every single time RSI approached this level, buyers appeared and momentum returned. It has now broken below it for the first time ever. When a floor that has held for the entire life of an asset finally gives way, the market is not sending a mixed message. It is sending the only message it has left.
3) Stochastic RSI at the floor. The Stochastic RSI is printing at its lowest reading on this timeframe. A technical bounce from here is entirely possible and should be expected, oversold is not the same as bottomed. But the underlying momentum of this asset, measured over the 2 month timeframe, is in a condition it has never been in before. Bounces within structural breakdowns are selling opportunities, not recoveries. The 2022 bear market produced several violent rallies of 40-60%. None of them changed the destination.
4) Confirmed Double top distribution . The pattern has been here before. The Engulfing channel printed green accumulation signals at the 2019 base and the 2020 recovery, both correctly identified the beginning of major rallies. At the 2025-2026 top, the same channel printed distribution: red against green, a failed push into the upper band, bearish engulfing signals at the high. Compare this structure to the 2021 top. They are, to an uncomfortable degree, identical. The market has shown you this before. It is showing you it again.
Targets
1st target: $1,000, a round number. Former base of the 2021–2022 cycle. The market will want to test it. Expect a reaction.
2nd target: $800 and below. The bear flag measured move. Annotated directly on the chart.
3rd target: $300-350 the golden ratio. Where hope becomes despair
What about the upside?
A confirmed 2-month close back above the bear flag’s upper boundary. .. approximately $3,500 cancels this idea entirely. If that happens, the pattern interpretation is wrong and the argument changes. Until then, the measured move stands. The burden of proof is not on the sellers here.
The crowd
The Ethereum community is a remarkable thing. Every bear market produces a freshly laundered set of reasons why the next one will be different. In 2018 it was the enterprise adoption narrative. In 2022 it was the merge. Now it is restaking, Layer 2 scaling, and BlackRock’s interest in tokenised assets. Each narrative is, genuinely, technically interesting. None of them has succeeded in preventing a pattern that has now repeated three times on the same timeframe, at approximately the same percentage drawdown, while the same community explains with great conviction why the price will not do what the price is doing. The gold medal for optimism in the face of a confirmed bear flag, a historic RSI breakdown, and a third 80% decline goes to ETH holders. Extraordinary people.
Is it possible ETH recovers from here, breaks all-time highs and becomes the reserve currency of the decentralised financial system? Of course it is. Anything is possible.
Is it probable, with a confirmed bear flag, the first ever break below RSI 47, a completed distribution top identical to 2021, and a measured move pointing at $800? Look left. Look at 2018. Look at 2022. Is this time different?
Ww
Type: Speculative short / educational | Timeframe: 6–18 months
===============================================
Disclaimer : This idea is for educational and informational purposes only. It is not financial advice. Trading cryptocurrencies involves extreme volatility and substantial risk of loss. Always do your own research and consult a qualified financial adviser before making any investment decisions. Past performance is not indicative of future results.
 Short
Short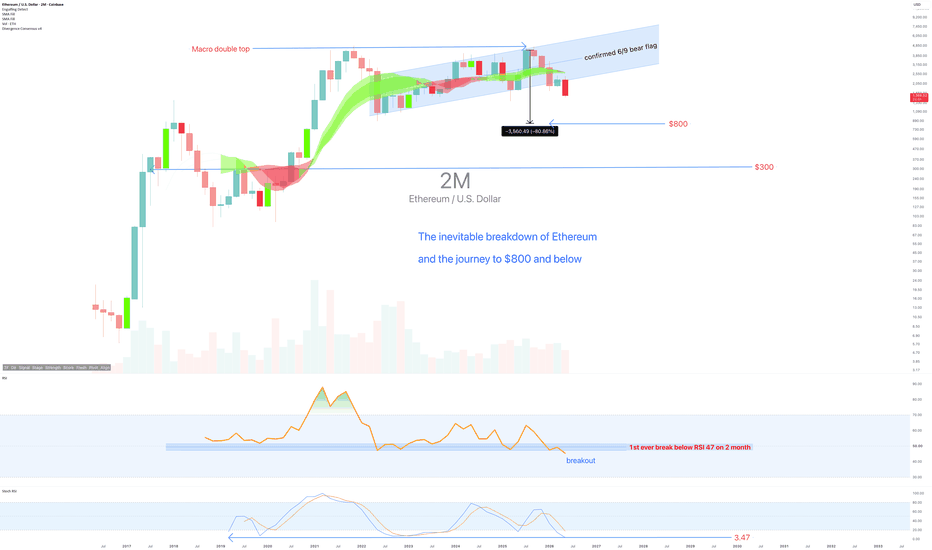
 Long
Long
 Short
Short
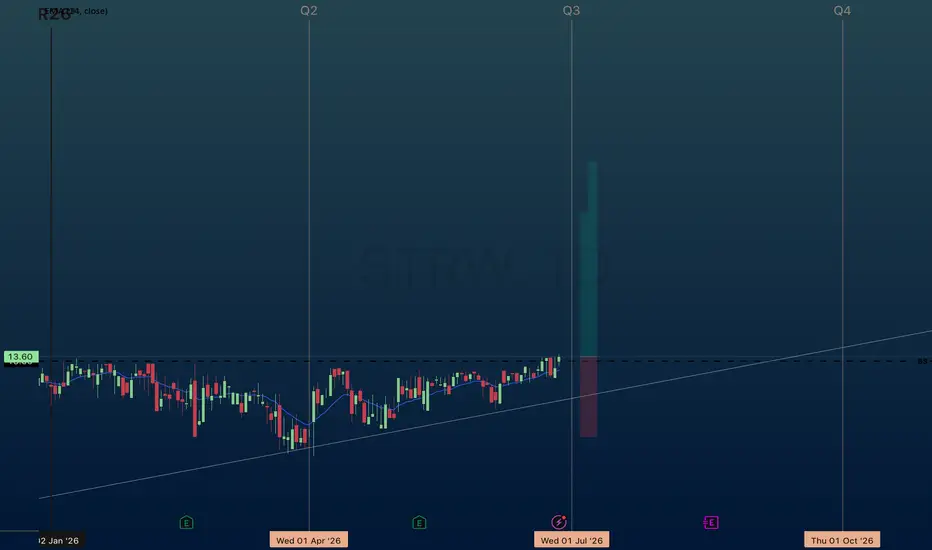
IMMR | July Q3 26' | Day ChartImmersion Corporation
"engages in the creation, design, development and licensing of patented haptic innovations and software. The firm offers touch sense platform and design services. It focuses on the following target application areas: mobile devices, wearable, consumer, mobile entertainment and other content, console gaming, automotive, medical, and commercial."
----------------------------------
IMMR revenue growing 20.01% YoY — strong top-line supports market-beating returns.
IMMR gross margin 21.25% — thin margin limits pricing power and long-run alpha.
IMMR FCF $10.43M positive — real cash generation, the #1 long-run predictor of market outperformance.
IMMR D/E ratio 0.55 — conservative leverage, balance sheet resilience favors outperformance.
-------------------------
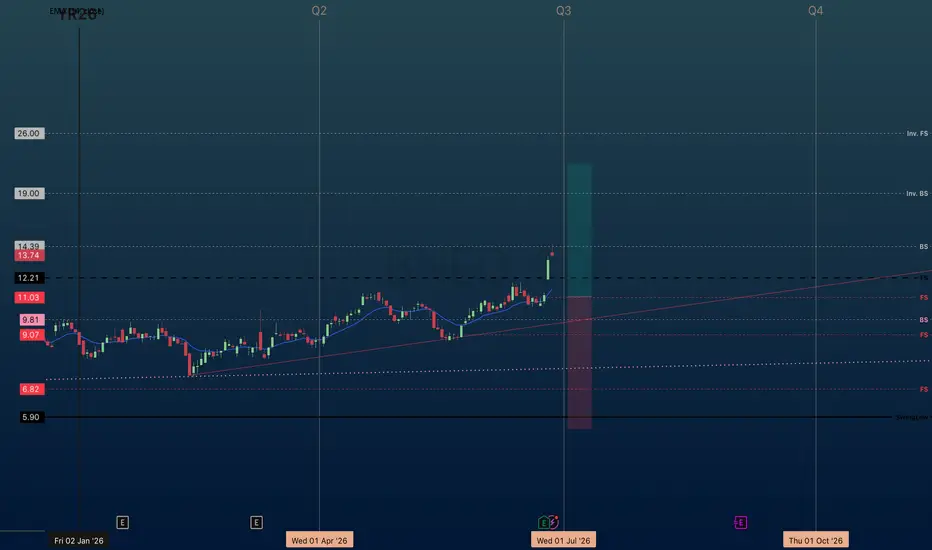
Multiple Time-Frame Analysis; Color Code | Strength favors the higher timeframe.
Yearly timeframe = black
Monthly timeframe = pink
weekly = grey
daily = red
4hr = orange
1hr = yellow
15min = blue
5min = green if they are shown. (Level visibility on intervals is set to timeframe the level was found on and below to keep chart view organized.)
** Candle Science explained **
A Range = two or more consecutive color candles.
There are two types of ranges - accumulation and distribution.
DISTRIBUTION RANGES DEFINED: BackSide (BS) Candle - First distribution candle in a distribution range. Expectation = strong reaction to price. long wicks reaching to or away from level.
FrontSide (FS) Candle - Last distribution candle in a distribution range. Expectation = reversal, create a trend in the opposite direction. Distribution candles are used as support.
ACCUMULATION RANGES DEFINED:
Inverse BS (Inv.BS) - First Accumulation candle in an accumulation range. Expectation. = strong reaction to price. long wicks reaching to or away from level.
Inverse FS (Inv.FS) - Last accumulation candle in an accumulation range. Expectation = reversal, create a trend in the opposite direction. Accumulation candles are used as resistance.
 Long
Long
Short 
 Long
Long