Long
Long
GNO: sleeper alert? watch key levels for the next few daysGNO. Anyone else watching this sleeper wake up again? According to industry sources, Gnosis is back in the spotlight with fresh ecosystem upgrades and more noise around payments and validators, while majors just range. The market reacted by dragging price right back into this old battlefield zone you see in orange on the 4H.
On the 4H chart, GNO is parked on a thick horizontal volume node around 118-120, a level that has flipped between support and resistance multiple times. RSI bounced from oversold and is now chopping just under 50, which looks more like a consolidation inside a trend than a final top. As long as we keep 118-120 on closing basis, I lean bullish, eyeing a move first into 124, then into that darker supply band above 130 where the last big sellers showed up.
My game plan: stalk dips into 118-120 with tight invalidation under 117, then scale out into 124 and 130+ if buyers step back in ✅. If 117 gives way with strong volume and RSI rolls under 40, I assume the level failed and let price slide toward 110 without me. I might be wrong, but this kind of balanced base right on a major volume node is exactly where I like to take my shot. SHLD (USA) - Defense Tech Momentum PlayContinuing the theme of investing in industries vs individual socks, the Global X Defense Tech ETF has been a standout performer with a massive 200% run over the last ~2 years. Not bad for an ETF. This fund focuses on companies that are bridging the gap between traditional military hardware and new-age tech like cybersecurity and AI. In the current global climate, the defense sector has shifted from being a slow-moving utility-style play into a high-growth momentum engine.
The fundamental story is driven by a massive increase in global security spending . With the US defense budget recently crossing the $1 trillion mark and NATO members ramping up their commitments, companies like Lockheed Martin and Palantir are looking at multi-year contract backlogs.
Technically, the price action is following a very structured trend. After hitting a peak near $78, the stock pulled back 10% to find support right around the 50-day SMA. This is a classic "buy the dip" area for a trend-following setup. The RSI has reset from overbought territory down to a bit below 60 , giving it plenty of room to move higher if the buyers return. While the MACD histogram is still in the red, the bars are getting shorter and we looks like we will get a crossover back to the upside again which usually suggests that the selling pressure is starting to dry up and buyers will come back in.
Could be one to keep an eye on.
..................................................
PLEASE NOTE: Nothing I post is trading advice. All investing involves risk, and past performance doesn’t predict future results. Trends can and do end. For 2026 , my goal is to try and post one new asset each trading day. Something outside the usual gold, silver, BTC, or big tech names. I like to find stocks worldwide showing steady trends with some good gains, a recent pullback, and signs of renewed strength. I don’t necessarily hold positions in these. They are simply companies I find interesting at the time of posting. I’ll often revisit them within a week to see how they went and share any updates. If you enjoy these posts, please BOOST and FOLLOW ME to discover more under-the-radar stocks and businesses from around the world.
.................................................. COMP: watching for a bounce? key levels to focus on todayCOMP. Who else is watching this DeFi OG drip straight back into the same demand zone that launched the last vertical candle? According to market chatter, DeFi names are back on the radar as traders rotate from majors into higher beta plays, and COMP is sitting right on the front row.
On the 4H chart, price is parked in the 17-18 support block, the same area that started the previous spike. RSI is hugging the 30 line, showing short-term exhaustion from sellers, while that sharp impulse up left a nice liquidity pocket above. For me that tilts the odds toward a bounce rather than an immediate breakdown, with 19.8 as the first magnet.
My base plan: bullish scalp from this zone toward 19.5-19.8, then reassess ✅ A clean 4H close below 17 would kill the long idea and open room toward 16 and maybe lower, so that is where I’d place my invalidation ⚠️ I might be wrong, but right now shorting directly into this support looks braver than buying the dip.  Long
Long
IOTA: accumulation phase or breakdown? key levels to watchIOTA. Still alive or just a museum exhibit in your watchlist? Recently the market’s been buzzing again about IOTA’s push into smart contracts and real‑world assets, but price is still camping at the lows, so risk/reward is getting interesting. While majors chop around, this kind of sleepy corner is often where the next rotation starts.
On the 4H chart, price is sitting in a fat demand zone around 0.066–0.068 with multiple wicks showing buyers defending. RSI is curling up from oversold and making a higher low, while the volume profile shows a low‑volume pocket up toward 0.07–0.072, so I’m leaning toward an upside squeeze from here. I might be wrong, but this looks more like accumulation than a breakdown.
My base case: continuation above the local range to 0.07–0.072, and if momentum holds, a test of the next red supply near 0.078. I’m interested in longs inside the green zone with tight risk below 0.066 and will start scaling out into those upside levels ✅. If we get a clean 4H close under support, the idea is dead for me and I’ll step aside, watching 0.062 as the next potential magnet. URNJ (USA) - Junior Uranium Miners Leveraging Off The AI BoomSometimes rather than try and pick an individual company that's going to be a winner in an emerging sector or industry, it can be a good alternative strategy to "bet" on the industry itself as an overall approach. I like the idea that we need massive amounts of new energy sources to power the rapidly growing AI industry. In my mind, (modern) Nuclear probably offers the cleanest and most scalable source of new energy production to meet these needs.
URNJ which is the Sprott Junior Uranium Miners ETF has been a standout performer in the nuclear space, showing a gain of roughly 174% from its lows around early April last year. This fund focuses on the mid and small-cap players in the uranium space, which are essentially the growth engines of the sector. As a trend follower, I like seeing this kind of relative strength in a niche that is becoming critical to the global infrastructure. While the big producers get the headlines, these juniors offer a way to play the broader shift toward nuclear energy as the world realizes how much power the AI revolution actually requires.
The fundamental story here is about the collision of massive energy needs and strict environmental promises . Big tech companies like Google, Microsoft, and Amazon are under immense pressure to meet "Net Zero" targets, so they simply cannot turn to coal to power their massive AI data centers. Public sentiment is already wary of how much electricity these AI clusters consume, and adding a huge carbon footprint on top of that would be a PR disaster.
Nuclear is the only carbon-free source that provides 24/7 baseload power, and the growing interest around Small Modular Reactors - the ones that can be moved in shipping containers - is a huge part of this. I prefer the ETF approach here because junior miners are notoriously risky individually; a single permit delay can tank a stock. But by holding the basket, I’m betting on the industry trend while letting the juniors provide the "torque" or leverage to the uranium price that you don't always get with the massive, slower-moving producers. Likewise rather than investing in these small nuclear power plants in a box, I'd prefer to be putting money into the raw materials that power them .
Technically, the chart is looking like a textbook pullback in a strong uptrend. After a massive run into the start of the year, price action cooled off and drifted back to a much better value area. We’ve seen the price find support right around the 50-day SMA, and we have just closed above the 20-day which is often where buyers step back in. What I really like is the building volume we’ve seen since mid-January, and now again over the last few sessions as the price starts to curl back up. The RSI and MACD have both reset from overbought levels and are looking much more bullish now, suggesting that the recent selling pressure has finally dried up.
If you like the idea of investing in an industry powering the future, this could be one to keep an eye on.
..................................................
PLEASE NOTE: Nothing I post is trading advice. All investing involves risk, and past performance doesn’t predict future results. Trends can and do end. For 2026 , my goal is to try and post one new asset each trading day. Something outside the usual gold, silver, BTC, or big tech names. I like to find stocks worldwide showing steady trends with some good gains, a recent pullback, and signs of renewed strength. I don’t necessarily hold positions in these. They are simply companies I find interesting at the time of posting. I’ll often revisit them within a week to see how they went and share any updates. If you enjoy these posts, please BOOST and FOLLOW ME to discover more under-the-radar stocks and businesses from around the world.
..................................................  Long
Long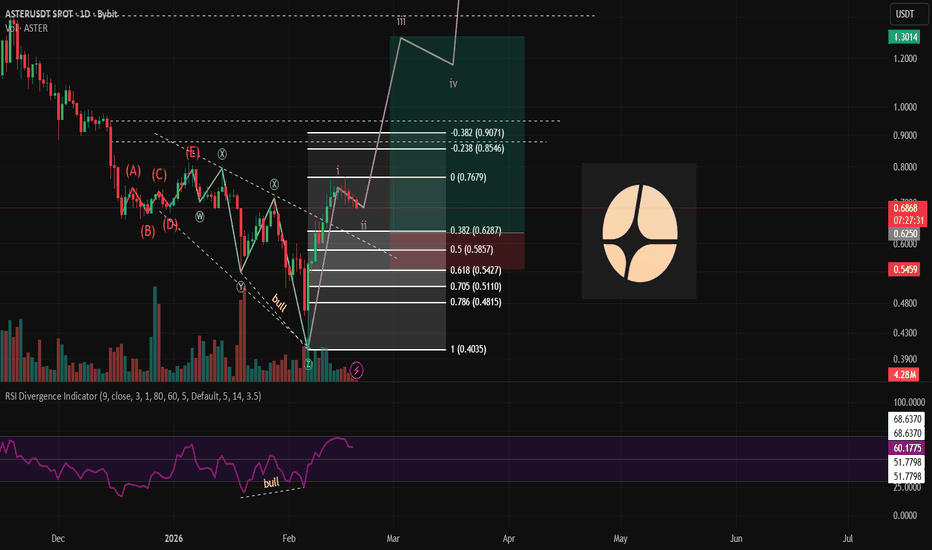
KRMN (USA) - Aerospace Momentum Testing Long-Term SupportKarman Holdings Inc is a relative newcomer but has been a standout performer over the last twelve months, with the share price climbing over 170% from its lows - and thats after a 40% recent pullback. They are a specialized player in the aerospace and defense sector, focusing on mission-critical systems for missiles, space launches, and hypersonics. When a stock moves this fast, it usually attracts a lot of momentum investors, but it also creates opportunities when things finally cool off for a bit which it has now.
Fundamentally, the business looks like it has plenty of wind in its sails. The company recently raised its revenue guidance for 2026 and completed some strategic acquisitions to expand its footprint in U.S. Navy programs. We saw a fairly sharp pullback recently, which seems to have been triggered by a mix of insider selling and the market simply catching its breath after a massive run to record highs. Given the current geopolitical environment and the ramp-up in defense spending, the long-term demand for their tech appears steady.
Looking at the technicals, the price action is currently testing an interesting area. After dropping from the $120 level, the stock has dipped just below the 100-day SMA which is often where long-term trend followers look for value. The RSI recently dipped toward oversold territory and is now starting to turn back up, while the MACD histogram shows that the aggressive selling pressure we saw last week is beginning to fade. It looks like the stock is trying to base here and hopefully begin to climb again.
Could be one to keep an eye on.
..................................................
PLEASE NOTE: Nothing I post is trading advice. All investing involves risk, and past performance doesn’t predict future results. Trends can and do end. For 2026 , my goal is to try and post one new asset each trading day. Something outside the usual gold, silver, BTC, or big tech names. I like to find stocks worldwide showing steady trends with some good gains, a recent pullback, and signs of renewed strength. I don’t necessarily hold positions in these. They are simply companies I find interesting at the time of posting. I’ll often revisit them within a week to see how they went and share any updates. If you enjoy these posts, please BOOST and FOLLOW ME to discover more under-the-radar stocks and businesses from around the world.
.................................................. BTCUSDT – Bearish Regime, No Long Until Structure RepairedPosture: Defensive / Capital Preservation
Thesis
We are not initiating a position at current levels and waiting for a signal.
The market remains in a high-trend, downside-favored regime. Price is trading below all relevant moving averages:
SMA200 ≈ 99,630
SMA50 ≈ 82,612
EMA20 ≈ 71,587
This is not noise — this is structural damage.
ADX ~58 confirms strong directional pressure. In a high-ADX environment, fading the trend is statistically low expectancy. RSI ~46 reflects weak momentum with no oversold edge. Liquidity context (ETF outflows + macro risk-off) aligns with technical breakdown.
This is a trend continuation environment, not a bottoming environment.
Structure & Order Flow
- Rejection cluster: 70–71k (EMA20 / failed reclaim zone)
- Price unable to hold above short-term dynamic resistance
- Lower highs intact
- Liquidity thinning into support
Until we see absorption and a structural reclaim, the path of least resistance remains down.
Key Levels
Resistance:
70,942 (EMA20 + recent rejection band)
82,611 (SMA50 – structural pivot)
Support:
60,000 (critical horizontal level)
Below 60k, the market opens risk toward accelerated downside continuation. Under stressed liquidity conditions, extension into low-40k region becomes technically consistent with current regime.
What Changes the Bias?
Bullish invalidation requires:
- Daily close above EMA20 (~71.5k)
- Sustained reclaim of 70–71k zone
- Expansion move toward SMA50 (~82.6k)
- Declining ADX during consolidation (trend exhaustion signal)
- Without those conditions, longs are premature.
Trade Plan
Current setup: No actionable entry.
This is a capital preservation phase.
Aggressive traders may look for short continuation on failed reclaim attempts into 70–71k, but that requires clear lower-timeframe rejection confirmation and defined risk.
No swing long until structure improves.
Risk Factors to Monitor
- ETF flow reversal
- Fed tone shift
- Sudden liquidity injection
- Order flow shift from distribution → absorption
Until those variables change, the regime remains bearish.
Conclusion:
Trend is intact to the downside. ADX confirms strength. Structure is broken. Stand aside or trade continuation — do not anticipate reversal without confirmation.
Not financial advice. Manage risk accordingly. GBPUSD A Sell Position For The Wrong ReasonsToday's trade followed some of our trading plan, but there were crucial rules that we broke and it seems that we will pay a good price for not following those rules.
We might have the general direction in our favor, but when it comes to adhering to our own trading rules, the execution was full of flaws.
Yes I will be happy to get a positive result, but a positive result with wrong implementation, in my point of view, is not trading.
I want to trade with confidence. Trading with confidence means trusting my trading plan. If I don't follow my rules, then I don't trust my plan, and therefore, I will be trading with emotions rather than rules.
Currently both open trades are going against me, but the general philosophy of the trade is still holding. The bad news is that, for the philosophy to be negated, that means that the price needs to move against me big time and it will hurt my account.
I increased my lot size because I didn't want to catch the full move. Now, I have the big size that will not allow me to wait for the trade philosophy to be negated.
I enjoy recording everything that is happening with me, because I think it is beneficial for my experience and also beneficial for anyone who is following my diary. I don't intend to become the go to trading Guru, I am one who would like to see traders taking up trading as a career, and this is exactly what I am testing, if trading is a good career choice.
The Investor AERO: is the downtrend over? key levels and targets aheadAERO. Tired of watching this one drip down the chart and wondering if the bleed is finally over? While the whole Base ecosystem is back in the headlines with growing volumes and fresh TVL inflows, AERO is quietly stabilizing after that long slide, and perp funding has cooled off according to the market. That’s usually when smart money starts positioning.
On the 4H chart we’ve got a clear downtrend, but price has printed a higher low above the 0.28 support zone and is sitting on a big volume node around 0.31. RSI is holding above 50 after an overbought spike, so momentum is cooling, not dying. If buyers defend this POC area, I’m leaning toward a push into the 0.34–0.35 supply, and if that breaks, 0.38–0.40 opens up fast ✅
My base case: look for longs on dips into 0.305–0.31 with targets at 0.34 then 0.38, invalidation on a clean 4H close below 0.29. If 0.28 cracks, I flip the script and expect trend continuation toward 0.25 with short setups only. I might be wrong, but catching bounces off strong volume levels has paid my bills more often than not 😄  Short
Short
STRK: falling knife or hidden gem? key levels to watchSTRK. Still hoping this thing suddenly moons after the airdrop hype? While the ecosystem keeps dropping “growth” headlines, the market is clearly focused on unlocks and fresh supply, and you can see it in the price action – every bounce gets sold almost instantly. According to industry sources, funds are still rotating into majors, so small caps like STRK are left to fend for themselves.
On the 4H chart we’re in a clean downtrend, and the last bounce stalled right under the main volume node around 0.050–0.052 – classic supply zone. RSI just rolled down from overbought back under 50, confirming fading momentum, so I’m leaning short, expecting continuation of the grind lower rather than a sudden reversal. I might be wrong, but right now STRK looks more like a falling knife than a hidden gem.
My base case ✅ short bias while price stays below 0.052 with targets toward 0.046 first and then 0.043 if the selloff accelerates. If buyers suddenly punch through 0.052 and hold above that on volume, the script flips and we can easily squeeze into 0.056–0.058 where the next heavy resistance sits. I’m watching for weak retests of 0.050 to build shorts, and I’ll step aside fast if that level starts acting as firm support.