OPEN-SOURCE SCRIPT
BTC Halving Indicator
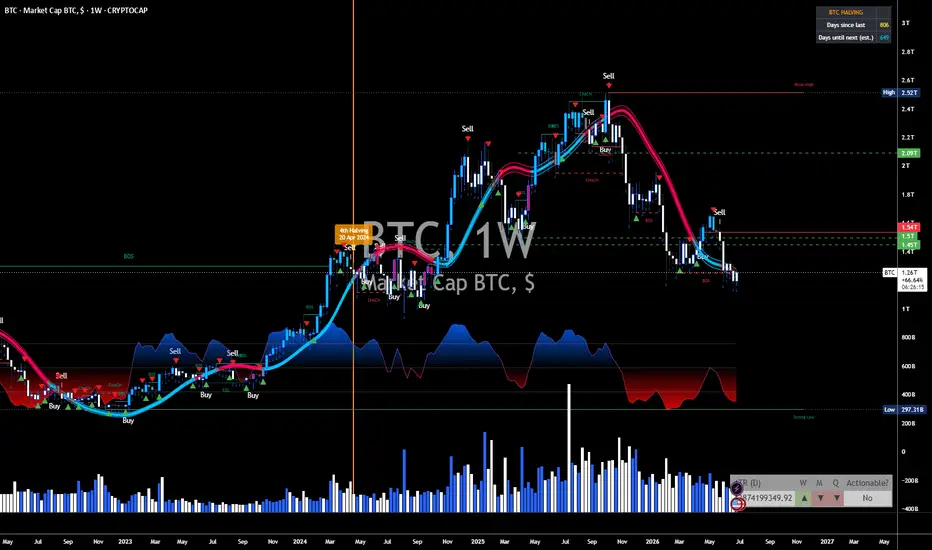
**What it does:**
- Draws an **orange vertical line + label** at each past halving: 28 Nov 2012, 9 Jul 2016, 11 May 2020, and 20 Apr 2024
- Draws a **dashed aqua line** at the estimated 5th halving (~April 2028) when it's close enough to appear on your chart
- Shows a **live counter table** in the top-right: days since the last halving and estimated days until the next one
- Has settings to change colors and toggle the labels/counter on or off
**How to install it in TradingView:**
1. Open a BTC chart (e.g. BTCUSD) on tradingview.com
2. Click **Pine Editor** at the bottom of the screen
3. Delete whatever's in the editor, paste in the full contents of the file
4. Click **Save**, then **Add to chart**
Two tips: use the **daily or weekly timeframe** — on low timeframes like 5m, TradingView doesn't load history back to 2012, so the older halving lines won't appear. And note the 2028 date is an estimate; the actual halving happens at block 1,050,000, so the real date drifts slightly with block times.
Want me to add anything, like cycle-phase background shading or price-at-halving markers?
Script open-source
Dans l'esprit TradingView, le créateur de ce script l'a rendu open source afin que les traders puissent examiner et vérifier ses fonctionnalités. Bravo à l'auteur! Bien que vous puissiez l'utiliser gratuitement, n'oubliez pas que la republication du code est soumise à nos Règles.

Clause de non-responsabilité
Les informations et publications ne sont pas destinées à être, et ne constituent pas, des conseils ou recommandations financiers, d'investissement, de trading ou autres fournis ou approuvés par TradingView. Pour en savoir plus, consultez les Conditions d'utilisation.
Script open-source
Dans l'esprit TradingView, le créateur de ce script l'a rendu open source afin que les traders puissent examiner et vérifier ses fonctionnalités. Bravo à l'auteur! Bien que vous puissiez l'utiliser gratuitement, n'oubliez pas que la republication du code est soumise à nos Règles.
Clause de non-responsabilité
Les informations et publications ne sont pas destinées à être, et ne constituent pas, des conseils ou recommandations financiers, d'investissement, de trading ou autres fournis ou approuvés par TradingView. Pour en savoir plus, consultez les Conditions d'utilisation.