OPEN-SOURCE SCRIPT
CBR - USD Correlation
Fundamentals
The idea for this script is based on Fundamentals.
I wanted to verify the strength/weakness of the US dollar against other major economies
This will keep me on the right side of the "trend" .. bullish or bearish ?
In short, because Fundamentals Analysis are reflected via economic updates which influences what the price will be doing for the next couple of days
I think it is fair to have an "Indy" that will look at the moving averages across these pairs, because if the dollar sentiment changes, this will be reflected across the major economies
How to use it
This is not a buy/sell entry "Indy", nor a RSI type "Indy" where I tried to calculate overbought/oversold areas..
In fact, when this indy hits anything over 5 to max ( which is 12 ) ..that is a very strong signal and should be seen as such..bearish or bullish
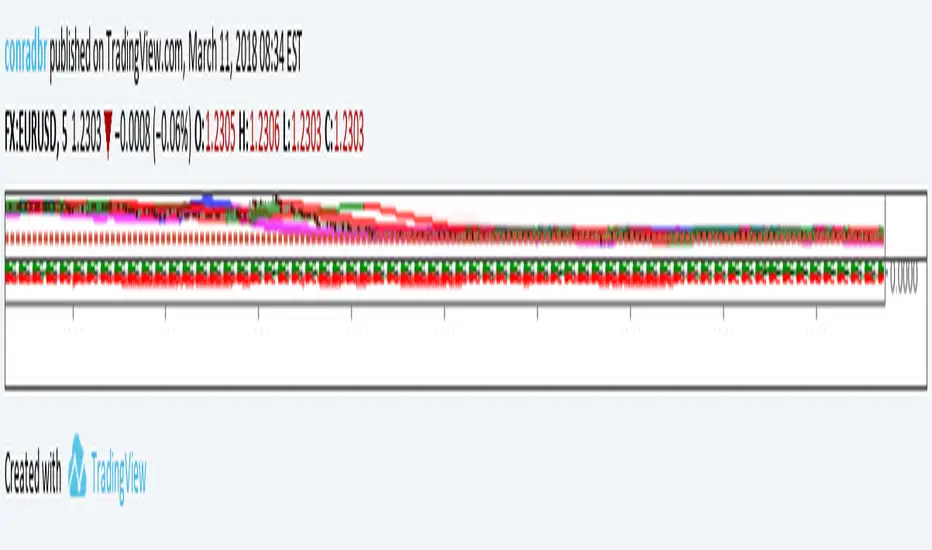
If you want to test it out, I would suggest use a plain chart ( naked chart ) with a 20 or 50 MA ( depending on your TF) and see how the currency pair e.g EUR/USD correlates with this indy. The default pairs are AUD/USD, NZD/USD, GBP/USD and USD/JPY, with a main chart on EUR/USD
Timeframes
1m and 5m charts, change the MA values to 3 ( short), 20 ( medium), 50 ( long) or even more, else there are too many false positives.
1H and higher timeframes works well with the current default values.
I
The idea for this script is based on Fundamentals.
I wanted to verify the strength/weakness of the US dollar against other major economies
This will keep me on the right side of the "trend" .. bullish or bearish ?
In short, because Fundamentals Analysis are reflected via economic updates which influences what the price will be doing for the next couple of days
I think it is fair to have an "Indy" that will look at the moving averages across these pairs, because if the dollar sentiment changes, this will be reflected across the major economies
How to use it
This is not a buy/sell entry "Indy", nor a RSI type "Indy" where I tried to calculate overbought/oversold areas..
In fact, when this indy hits anything over 5 to max ( which is 12 ) ..that is a very strong signal and should be seen as such..bearish or bullish
If you want to test it out, I would suggest use a plain chart ( naked chart ) with a 20 or 50 MA ( depending on your TF) and see how the currency pair e.g EUR/USD correlates with this indy. The default pairs are AUD/USD, NZD/USD, GBP/USD and USD/JPY, with a main chart on EUR/USD
Timeframes
1m and 5m charts, change the MA values to 3 ( short), 20 ( medium), 50 ( long) or even more, else there are too many false positives.
1H and higher timeframes works well with the current default values.
I
Script open-source
Dans l'esprit TradingView, le créateur de ce script l'a rendu open source afin que les traders puissent examiner et vérifier ses fonctionnalités. Bravo à l'auteur! Bien que vous puissiez l'utiliser gratuitement, n'oubliez pas que la republication du code est soumise à nos Règles.

Clause de non-responsabilité
Les informations et publications ne sont pas destinées à être, et ne constituent pas, des conseils ou recommandations financiers, d'investissement, de trading ou autres fournis ou approuvés par TradingView. Pour en savoir plus, consultez les Conditions d'utilisation.
Script open-source
Dans l'esprit TradingView, le créateur de ce script l'a rendu open source afin que les traders puissent examiner et vérifier ses fonctionnalités. Bravo à l'auteur! Bien que vous puissiez l'utiliser gratuitement, n'oubliez pas que la republication du code est soumise à nos Règles.
Clause de non-responsabilité
Les informations et publications ne sont pas destinées à être, et ne constituent pas, des conseils ou recommandations financiers, d'investissement, de trading ou autres fournis ou approuvés par TradingView. Pour en savoir plus, consultez les Conditions d'utilisation.