OPEN-SOURCE SCRIPT
Mis à jour Ichimoku Trend Oscillator [Gabremoku]
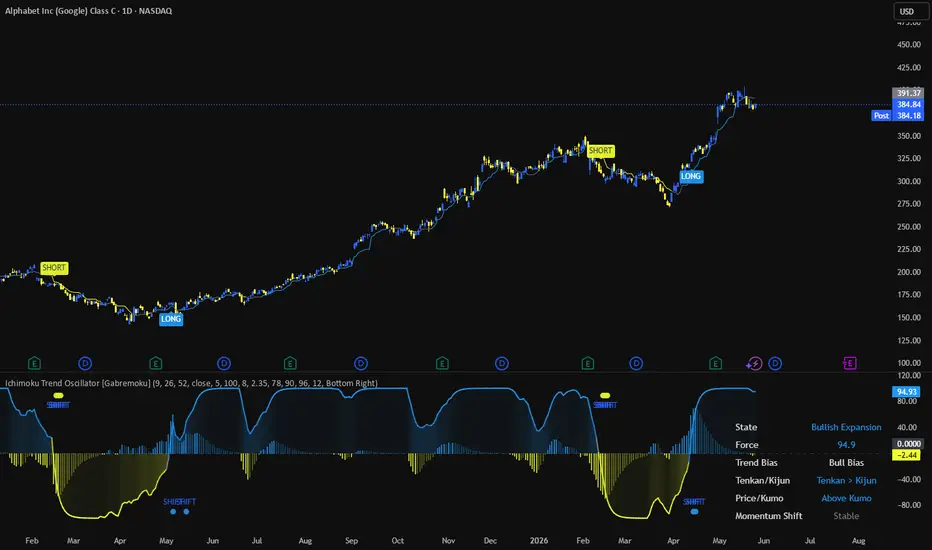
Ichimoku Trend Oscillator [Gabremoku] is a custom trend-following oscillator that transforms core Ichimoku components into a normalized trend force model, designed to make bullish and bearish pressure easier to read in a single lower-panel view.
Instead of plotting the full traditional Ichimoku Cloud on price, this script converts the relationship between Tenkan, Kijun, Kumo structure, and price location vs cloud into a smoothed oscillator with:
a central zero line
trend force scoring
histogram confirmation
momentum shift detection
optional Tenkan force overlay on the main chart
The Ichimoku framework is commonly used to evaluate trend, momentum, and support/resistance at a glance, especially through the relationship between price and cloud position, plus the Tenkan/Kijun structure.
What it shows
📉 Trend Force Line — the main oscillator line represents a normalized force score derived from:
Tenkan vs Kijun spread
price location relative to the cloud
bullish or bearish cloud structure
📊 Histogram — visualizes the difference between the force line and its signal line, helping show momentum acceleration or deceleration.
🌈 Soft Gradient Fill — the oscillator fill changes intensity depending on how far trend force is from zero.
📍 Tenkan Force Overlay — optionally plots the Tenkan line on the main chart with dynamic color logic tied to trend condition.
🚦 Signals — the script can display:
LONG on bullish zero-line cross
SHORT on bearish zero-line cross
SHIFT markers when momentum changes sharply without a fresh zero cross
🪧 Dashboard — displays state, force value, trend bias, Tenkan/Kijun relation, price vs Kumo position, and momentum-shift status.
Core logic
The script compresses several Ichimoku readings into one oscillator.
It combines:
Tenkan/Kijun directional spread
price above / inside / below cloud
cloud directional structure
ATR-based normalization
and smoothing for cleaner force transitions
This matters because in standard Ichimoku interpretation:
price above the cloud is usually read as bullish context
price below the cloud is usually read as bearish context
Tenkan above Kijun supports bullish alignment, while the opposite supports bearish alignment
By translating those conditions into a normalized oscillator, the script gives traders a faster way to read trend quality and directional pressure without plotting the full classic system every time.
State model
The oscillator classifies the market into states such as:
Bullish Expansion
Bullish Pressure
Bearish Expansion
Bearish Pressure
Neutral
This is useful because it separates simple directional bias from stronger “expansion” conditions where multiple Ichimoku elements are aligned.
For example:
force above zero suggests bullish pressure
force below zero suggests bearish pressure
stronger positive or negative readings reflect stronger directional alignment
SHIFT signals are used to highlight sudden changes in momentum before a full regime flip
How to use
A practical workflow is:
Use the zero line as the primary directional divider.
Use the force line to judge strength.
Use the histogram to evaluate acceleration or fading momentum.
Watch for SHIFT markers when force changes quickly.
Use the Tenkan overlay on the main chart as an additional structure guide.
In general:
cross above zero = bullish transition
cross below zero = bearish transition
force staying far from zero = stronger trend persistence
shift signals = possible early momentum change without full bias reversal yet
Features
✅ Ichimoku-based lower-panel oscillator
✅ Trend force model built from Tenkan, Kijun, Kumo, and price/cloud relationship
✅ ATR-normalized force engine
✅ Smoothed force line
✅ Signal line and histogram
✅ Soft gradient fill around zero
✅ LONG / SHORT zero-cross signals
✅ Bullish / bearish momentum shift markers
✅ Optional Tenkan force overlay on the main chart
✅ Live dashboard with state and bias information
Notes
This indicator is designed to turn Ichimoku structure into a more compact trend momentum oscillator, not to replace full discretionary Ichimoku analysis. It works best as a directional filter or timing aid when combined with price structure, support/resistance, or a broader trend framework.
Author: Gabremoku
Pine Script v6
Instead of plotting the full traditional Ichimoku Cloud on price, this script converts the relationship between Tenkan, Kijun, Kumo structure, and price location vs cloud into a smoothed oscillator with:
a central zero line
trend force scoring
histogram confirmation
momentum shift detection
optional Tenkan force overlay on the main chart
The Ichimoku framework is commonly used to evaluate trend, momentum, and support/resistance at a glance, especially through the relationship between price and cloud position, plus the Tenkan/Kijun structure.
What it shows
📉 Trend Force Line — the main oscillator line represents a normalized force score derived from:
Tenkan vs Kijun spread
price location relative to the cloud
bullish or bearish cloud structure
📊 Histogram — visualizes the difference between the force line and its signal line, helping show momentum acceleration or deceleration.
🌈 Soft Gradient Fill — the oscillator fill changes intensity depending on how far trend force is from zero.
📍 Tenkan Force Overlay — optionally plots the Tenkan line on the main chart with dynamic color logic tied to trend condition.
🚦 Signals — the script can display:
LONG on bullish zero-line cross
SHORT on bearish zero-line cross
SHIFT markers when momentum changes sharply without a fresh zero cross
🪧 Dashboard — displays state, force value, trend bias, Tenkan/Kijun relation, price vs Kumo position, and momentum-shift status.
Core logic
The script compresses several Ichimoku readings into one oscillator.
It combines:
Tenkan/Kijun directional spread
price above / inside / below cloud
cloud directional structure
ATR-based normalization
and smoothing for cleaner force transitions
This matters because in standard Ichimoku interpretation:
price above the cloud is usually read as bullish context
price below the cloud is usually read as bearish context
Tenkan above Kijun supports bullish alignment, while the opposite supports bearish alignment
By translating those conditions into a normalized oscillator, the script gives traders a faster way to read trend quality and directional pressure without plotting the full classic system every time.
State model
The oscillator classifies the market into states such as:
Bullish Expansion
Bullish Pressure
Bearish Expansion
Bearish Pressure
Neutral
This is useful because it separates simple directional bias from stronger “expansion” conditions where multiple Ichimoku elements are aligned.
For example:
force above zero suggests bullish pressure
force below zero suggests bearish pressure
stronger positive or negative readings reflect stronger directional alignment
SHIFT signals are used to highlight sudden changes in momentum before a full regime flip
How to use
A practical workflow is:
Use the zero line as the primary directional divider.
Use the force line to judge strength.
Use the histogram to evaluate acceleration or fading momentum.
Watch for SHIFT markers when force changes quickly.
Use the Tenkan overlay on the main chart as an additional structure guide.
In general:
cross above zero = bullish transition
cross below zero = bearish transition
force staying far from zero = stronger trend persistence
shift signals = possible early momentum change without full bias reversal yet
Features
✅ Ichimoku-based lower-panel oscillator
✅ Trend force model built from Tenkan, Kijun, Kumo, and price/cloud relationship
✅ ATR-normalized force engine
✅ Smoothed force line
✅ Signal line and histogram
✅ Soft gradient fill around zero
✅ LONG / SHORT zero-cross signals
✅ Bullish / bearish momentum shift markers
✅ Optional Tenkan force overlay on the main chart
✅ Live dashboard with state and bias information
Notes
This indicator is designed to turn Ichimoku structure into a more compact trend momentum oscillator, not to replace full discretionary Ichimoku analysis. It works best as a directional filter or timing aid when combined with price structure, support/resistance, or a broader trend framework.
Author: Gabremoku
Pine Script v6
Notes de version
Update Notes — Ichimoku Trend Oscillator [Gabremoku]Small but useful quality-of-life update, based on feedback from several of you.
Dashboard position and size control
The dashboard can now be freely repositioned to any corner of the chart — Top Right, Top Left, Bottom Right, or Bottom Left — directly from the Dashboard settings group.
Text size is also now selectable between Tiny, Small, and Normal, which makes a real difference when using this indicator in a small pane alongside other tools, or on a compact layout with multiple oscillators.
No changes to the core calculation logic.
Script open-source
Dans l'esprit TradingView, le créateur de ce script l'a rendu open source afin que les traders puissent examiner et vérifier ses fonctionnalités. Bravo à l'auteur! Bien que vous puissiez l'utiliser gratuitement, n'oubliez pas que la republication du code est soumise à nos Règles.

Clause de non-responsabilité
Les informations et publications ne sont pas destinées à être, et ne constituent pas, des conseils ou recommandations financiers, d'investissement, de trading ou autres fournis ou approuvés par TradingView. Pour en savoir plus, consultez les Conditions d'utilisation.
Script open-source
Dans l'esprit TradingView, le créateur de ce script l'a rendu open source afin que les traders puissent examiner et vérifier ses fonctionnalités. Bravo à l'auteur! Bien que vous puissiez l'utiliser gratuitement, n'oubliez pas que la republication du code est soumise à nos Règles.
Clause de non-responsabilité
Les informations et publications ne sont pas destinées à être, et ne constituent pas, des conseils ou recommandations financiers, d'investissement, de trading ou autres fournis ou approuvés par TradingView. Pour en savoir plus, consultez les Conditions d'utilisation.