Fair Value Gaps - Fill Rate Statistics [Dots3Red]
🔲 FAIR VALUE GAPS - FILL RATE STATISTICS [Dots3Red]
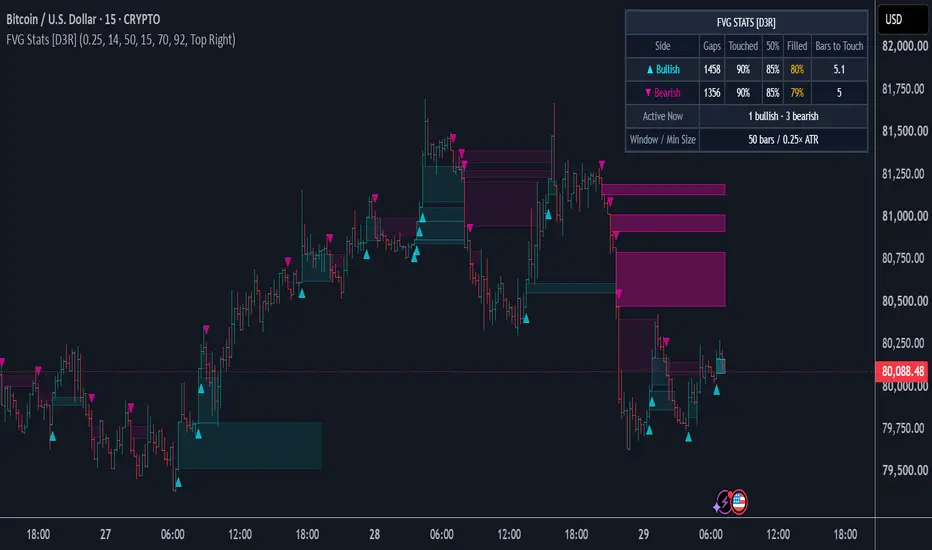
This indicator detects fair value gaps (three-candle price imbalances), draws them on the chart, and measures how often price came back to touch, half-fill and fully fill those gaps on the current chart, along with how long it typically took.
✨ WHY THIS MATTERS
The common belief is that price "has to" come back and fill them. Sometimes it does quickly, sometimes it takes ages, and sometimes it never does. How often gaps get revisited varies widely between instruments, timeframes and gap sizes. This script keeps score so you can see how fair value gaps actually behave on your chart.
⚙️ HOW IT WORKS
🔍 Detection — a bullish gap forms when a candle's low is above the high from two candles earlier, leaving a zone the middle candle moved through without any overlap. A bearish gap is the mirror image. Gaps smaller than a set fraction of ATR are ignored as noise.
📦 Drawing — each gap is drawn as a box that extends to the right while it is being tracked. When it fills, it fades; when its tracking window ends unfilled, it gets a dotted border. You can also remove finished gaps entirely.
🎯 Fill tracking — every gap is followed for a set number of bars. During that window the script records whether price:
• Touched it — came back into the gap at least once
• Half-filled it — reached the gap's midpoint
• Fully filled it — reached the far edge
It also records how many bars passed before the first touch.
🔒 Non-repainting — gaps are confirmed on closed candles, and all tracking uses confirmed bars only.
🖥️ Dashboard — gaps counted, touched %, 50% %, filled %, and average bars to first touch, for each side, plus how many gaps are active right now.
🧭 HOW TO USE
1️⃣ Compare touched vs filled. Many instruments revisit gaps often but rarely fill them completely. That tells you whether the near edge or the far edge is the more realistic level.
2️⃣ Use "bars to touch" for patience. If gaps are typically revisited within 8 bars, a gap untouched after 40 bars is behaving unusually.
3️⃣ Compare bullish and bearish gaps. In a trending market, gaps against the trend often fill far more readily than gaps with it.
4️⃣ Adjust minimum gap size. Larger gaps are rarer and may behave differently from small ones.
5️⃣ Use it as context, not a trigger. The rates describe how gaps have behaved on this chart. They do not predict what the next gap will do.
⏱️ WHICH TIMEFRAMES WORK BEST
5-minute through 4-hour gives enough gaps to build a sample while keeping each gap meaningful. Daily works on instruments with long history.
🛠️ SETTINGS
🔍 Gap Detection — minimum gap size (× ATR), ATR length
🎯 Fill Tracking — how many bars each gap is tracked, minimum gaps to show rates
🎨 Visuals — draw bullish/bearish gaps, colors, active transparency, keep filled/expired gaps and their transparency
🖥️ Dashboard — show/hide, position
🔔 Alerts — new bullish gap, new bearish gap, price entered a bullish gap, price entered a bearish gap
📝 NOTES
A gap is counted once its tracking window ends or it is fully filled, so the most recent gaps are not yet in the statistics. All rates are specific to this chart, timeframe and settings, and do not transfer to other instruments or configurations.
⚠️ DISCLAIMER
This is an analytical and visualization tool. It does not generate trade signals and does not constitute financial advice. Historical statistics do not guarantee future performance.
This indicator detects fair value gaps (three-candle price imbalances), draws them on the chart, and measures how often price came back to touch, half-fill and fully fill those gaps on the current chart, along with how long it typically took.
✨ WHY THIS MATTERS
The common belief is that price "has to" come back and fill them. Sometimes it does quickly, sometimes it takes ages, and sometimes it never does. How often gaps get revisited varies widely between instruments, timeframes and gap sizes. This script keeps score so you can see how fair value gaps actually behave on your chart.
⚙️ HOW IT WORKS
🔍 Detection — a bullish gap forms when a candle's low is above the high from two candles earlier, leaving a zone the middle candle moved through without any overlap. A bearish gap is the mirror image. Gaps smaller than a set fraction of ATR are ignored as noise.
📦 Drawing — each gap is drawn as a box that extends to the right while it is being tracked. When it fills, it fades; when its tracking window ends unfilled, it gets a dotted border. You can also remove finished gaps entirely.
🎯 Fill tracking — every gap is followed for a set number of bars. During that window the script records whether price:
• Touched it — came back into the gap at least once
• Half-filled it — reached the gap's midpoint
• Fully filled it — reached the far edge
It also records how many bars passed before the first touch.
🔒 Non-repainting — gaps are confirmed on closed candles, and all tracking uses confirmed bars only.
🖥️ Dashboard — gaps counted, touched %, 50% %, filled %, and average bars to first touch, for each side, plus how many gaps are active right now.
🧭 HOW TO USE
1️⃣ Compare touched vs filled. Many instruments revisit gaps often but rarely fill them completely. That tells you whether the near edge or the far edge is the more realistic level.
2️⃣ Use "bars to touch" for patience. If gaps are typically revisited within 8 bars, a gap untouched after 40 bars is behaving unusually.
3️⃣ Compare bullish and bearish gaps. In a trending market, gaps against the trend often fill far more readily than gaps with it.
4️⃣ Adjust minimum gap size. Larger gaps are rarer and may behave differently from small ones.
5️⃣ Use it as context, not a trigger. The rates describe how gaps have behaved on this chart. They do not predict what the next gap will do.
⏱️ WHICH TIMEFRAMES WORK BEST
5-minute through 4-hour gives enough gaps to build a sample while keeping each gap meaningful. Daily works on instruments with long history.
🛠️ SETTINGS
🔍 Gap Detection — minimum gap size (× ATR), ATR length
🎯 Fill Tracking — how many bars each gap is tracked, minimum gaps to show rates
🎨 Visuals — draw bullish/bearish gaps, colors, active transparency, keep filled/expired gaps and their transparency
🖥️ Dashboard — show/hide, position
🔔 Alerts — new bullish gap, new bearish gap, price entered a bullish gap, price entered a bearish gap
📝 NOTES
A gap is counted once its tracking window ends or it is fully filled, so the most recent gaps are not yet in the statistics. All rates are specific to this chart, timeframe and settings, and do not transfer to other instruments or configurations.
⚠️ DISCLAIMER
This is an analytical and visualization tool. It does not generate trade signals and does not constitute financial advice. Historical statistics do not guarantee future performance.

Connect the dots to elevate your trading.
Clause de non-responsabilité
Les informations et publications ne sont pas destinées à être, et ne constituent pas, des conseils ou recommandations financiers, d'investissement, de trading ou autres fournis ou approuvés par TradingView. Pour en savoir plus, consultez les Conditions d'utilisation.
Connect the dots to elevate your trading.
Clause de non-responsabilité
Les informations et publications ne sont pas destinées à être, et ne constituent pas, des conseils ou recommandations financiers, d'investissement, de trading ou autres fournis ou approuvés par TradingView. Pour en savoir plus, consultez les Conditions d'utilisation.