OPEN-SOURCE SCRIPT
HTF Candles (Accurate)
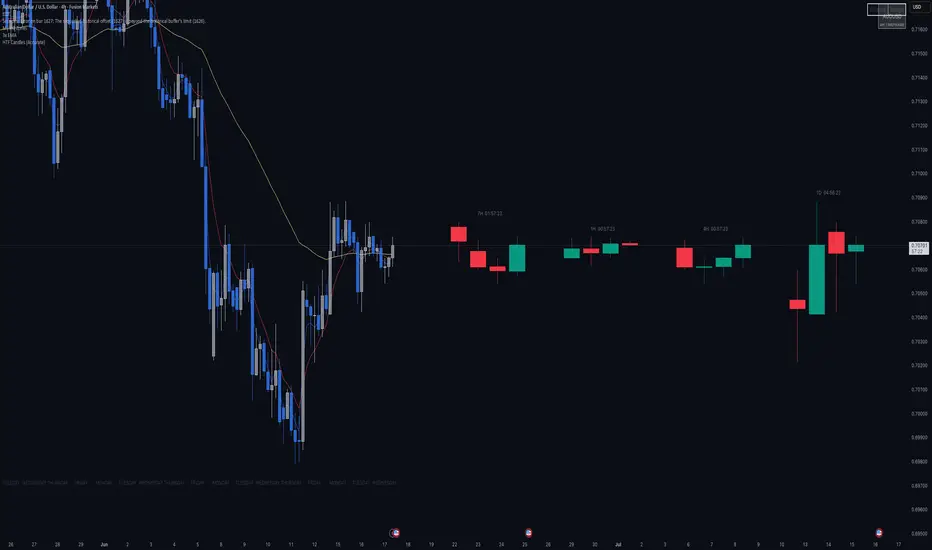
HTF Candles (Accurate)
See the last few candles of several timeframes right next to your live price action — without ever leaving your chart. Trade a lower timeframe while keeping the higher-timeframe picture in view at all times.
What it does
The indicator draws a small group of recent candles for each timeframe you turn on, just to the right of the current market. A label above each group shows the timeframe (for example 1H, 4H, 1D) and a live countdown to that candle's close. The right-most candle in every group is the one currently forming.
Each candle is drawn at its true price level, so the higher- and lower-timeframe structure lines up with the price on your chart.
Accurate by design
Switch your chart to any of the displayed timeframes and the candles match exactly — open, high, low and close. Whether a timeframe is higher or lower than your current chart, the candles stay true to the real ones, so what you see projected is what you'd see if you changed timeframe.
Features
Up to 6 independent timeframe slots, each with its own number of candles
Works for timeframes both above and below your current chart
Live countdown to each candle's close
Fully adjustable colors for up/down bodies, borders and wicks
Adjustable spacing, padding and candle width
Optional filter to show only timeframes higher than the chart
Inputs
Higher Timeframes — Turn on each slot, pick its timeframe, and choose how many candles to show.
Layout — Distance from the live price, space between candles, space between timeframe groups, and candle width.
Styling — Separate colors for up/down bodies, borders and wicks.
Labels — Show or hide the timeframe label and the countdown, and set the label color.
This indicator is a visualization tool. It does not generate buy or sell signals.
See the last few candles of several timeframes right next to your live price action — without ever leaving your chart. Trade a lower timeframe while keeping the higher-timeframe picture in view at all times.
What it does
The indicator draws a small group of recent candles for each timeframe you turn on, just to the right of the current market. A label above each group shows the timeframe (for example 1H, 4H, 1D) and a live countdown to that candle's close. The right-most candle in every group is the one currently forming.
Each candle is drawn at its true price level, so the higher- and lower-timeframe structure lines up with the price on your chart.
Accurate by design
Switch your chart to any of the displayed timeframes and the candles match exactly — open, high, low and close. Whether a timeframe is higher or lower than your current chart, the candles stay true to the real ones, so what you see projected is what you'd see if you changed timeframe.
Features
Up to 6 independent timeframe slots, each with its own number of candles
Works for timeframes both above and below your current chart
Live countdown to each candle's close
Fully adjustable colors for up/down bodies, borders and wicks
Adjustable spacing, padding and candle width
Optional filter to show only timeframes higher than the chart
Inputs
Higher Timeframes — Turn on each slot, pick its timeframe, and choose how many candles to show.
Layout — Distance from the live price, space between candles, space between timeframe groups, and candle width.
Styling — Separate colors for up/down bodies, borders and wicks.
Labels — Show or hide the timeframe label and the countdown, and set the label color.
This indicator is a visualization tool. It does not generate buy or sell signals.
Script open-source
Dans l'esprit TradingView, le créateur de ce script l'a rendu open source afin que les traders puissent examiner et vérifier ses fonctionnalités. Bravo à l'auteur! Bien que vous puissiez l'utiliser gratuitement, n'oubliez pas que la republication du code est soumise à nos Règles.

Clause de non-responsabilité
Les informations et publications ne sont pas destinées à être, et ne constituent pas, des conseils ou recommandations financiers, d'investissement, de trading ou autres fournis ou approuvés par TradingView. Pour en savoir plus, consultez les Conditions d'utilisation.
Script open-source
Dans l'esprit TradingView, le créateur de ce script l'a rendu open source afin que les traders puissent examiner et vérifier ses fonctionnalités. Bravo à l'auteur! Bien que vous puissiez l'utiliser gratuitement, n'oubliez pas que la republication du code est soumise à nos Règles.
Clause de non-responsabilité
Les informations et publications ne sont pas destinées à être, et ne constituent pas, des conseils ou recommandations financiers, d'investissement, de trading ou autres fournis ou approuvés par TradingView. Pour en savoir plus, consultez les Conditions d'utilisation.