Mis à jour
NLA Value Map
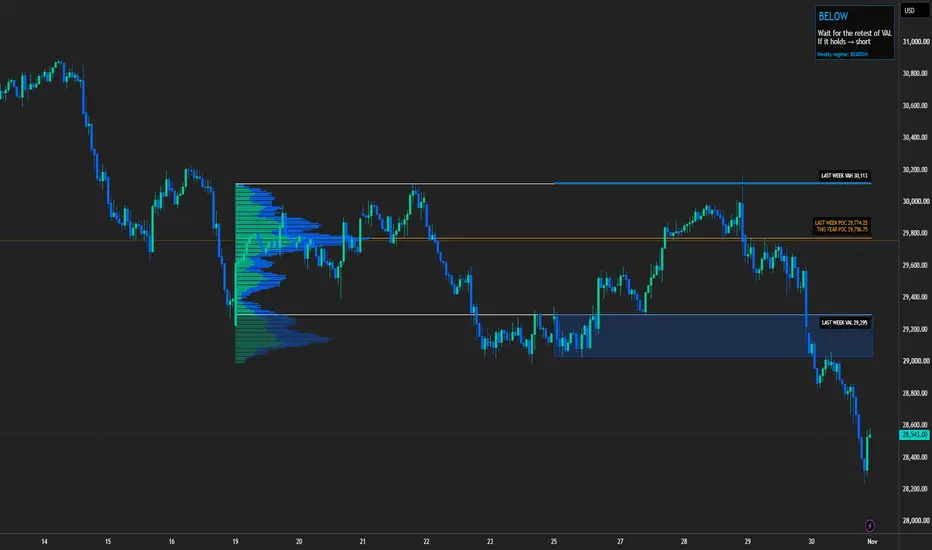
NLA Value Map draws last week's volume profile and carries its value area into the current week, so you can see at a glance where price is meeting last week's value.
WHAT IT SHOWS
• Last week's volume profile, drawn over last week's candles. Teal = volume traded on up candles, blue = volume on down candles, brighter inside the value area.
• Last week's value area high (VAH) and value area low (VAL) as white lines and the point of control (POC) as an amber line, carried through the current week.
• This year's value area so far (developing, from the first trading day of the year until now).
• A zone at each value-area edge (see below).
• Optional: yesterday's value area from the New York cash session only (09:30-16:00), last month's and last year's value areas, and the period before each one. The older levels matter after a big breakout, when price has left the latest value behind.
HOW THE PROFILE IS BUILT
• Real traded volume only. Each candle's volume is spread over the price rows it traded, in proportion to how much of its range sits in each row. 128 rows by default.
• Value area = 70% of the period's volume, built the standard way: start at the POC and keep adding the neighbouring row with more volume until 70% is inside.
• Built from 5-minute candles (daily), 15-minute (weekly), 30-minute (monthly) and 4-hour (yearly), so the levels are the same on any chart timeframe.
• A period is only drawn when the chart has loaded its full history. On very low chart timeframes the yearly levels may not show for that reason.
THE EDGE ZONES
Each zone starts at the VAH (or VAL) and runs outward through the volume that sits just outside the value area, until that volume runs out (by default: until a row holds less than 35% of the value area's average row, at most 40% of the value area's height). That cluster just outside value is where price often reacts. The thin area beyond it is where price often moves fast.
WEEKLY REGIME (top right)
• A week's POC steps up when it sits above the previous week's VAH, and steps down when it sits below the previous week's VAL.
• Two steps in the same direction in a row = BULLISH or BEARISH. Anything else = BALANCED.
• In a bullish regime last week's VAL zone is highlighted, in a bearish regime last week's VAH zone: the edge against the trend, where the reward-to-risk is best if price reacts there.
HOW TO READ IT
The POC is the middle of value, where nothing is decided. The edges are where buyers or sellers have to show their hand. Wait for price to react at a zone before you do anything.
SETTINGS
Daily, weekly, monthly and yearly levels on or off, the period before, which profile to draw, rows, value area %, profile width, zone cut-off and depth, regime on or off.
NOTES
• Built from candles, not tick data, so levels can differ by a few ticks from a tick-based profile.
• Needs real volume: works best on futures and stocks.
• For education only. Not financial advice.
WHAT IT SHOWS
• Last week's volume profile, drawn over last week's candles. Teal = volume traded on up candles, blue = volume on down candles, brighter inside the value area.
• Last week's value area high (VAH) and value area low (VAL) as white lines and the point of control (POC) as an amber line, carried through the current week.
• This year's value area so far (developing, from the first trading day of the year until now).
• A zone at each value-area edge (see below).
• Optional: yesterday's value area from the New York cash session only (09:30-16:00), last month's and last year's value areas, and the period before each one. The older levels matter after a big breakout, when price has left the latest value behind.
HOW THE PROFILE IS BUILT
• Real traded volume only. Each candle's volume is spread over the price rows it traded, in proportion to how much of its range sits in each row. 128 rows by default.
• Value area = 70% of the period's volume, built the standard way: start at the POC and keep adding the neighbouring row with more volume until 70% is inside.
• Built from 5-minute candles (daily), 15-minute (weekly), 30-minute (monthly) and 4-hour (yearly), so the levels are the same on any chart timeframe.
• A period is only drawn when the chart has loaded its full history. On very low chart timeframes the yearly levels may not show for that reason.
THE EDGE ZONES
Each zone starts at the VAH (or VAL) and runs outward through the volume that sits just outside the value area, until that volume runs out (by default: until a row holds less than 35% of the value area's average row, at most 40% of the value area's height). That cluster just outside value is where price often reacts. The thin area beyond it is where price often moves fast.
WEEKLY REGIME (top right)
• A week's POC steps up when it sits above the previous week's VAH, and steps down when it sits below the previous week's VAL.
• Two steps in the same direction in a row = BULLISH or BEARISH. Anything else = BALANCED.
• In a bullish regime last week's VAL zone is highlighted, in a bearish regime last week's VAH zone: the edge against the trend, where the reward-to-risk is best if price reacts there.
HOW TO READ IT
The POC is the middle of value, where nothing is decided. The edges are where buyers or sellers have to show their hand. Wait for price to react at a zone before you do anything.
SETTINGS
Daily, weekly, monthly and yearly levels on or off, the period before, which profile to draw, rows, value area %, profile width, zone cut-off and depth, regime on or off.
NOTES
• Built from candles, not tick data, so levels can differ by a few ticks from a tick-based profile.
• Needs real volume: works best on futures and stocks.
• For education only. Not financial advice.
Notes de version
v1.1: a cleaner chart for beginners.- Labels now show only the level and its price, written just above the line (under it for a VAL), so no line runs through the text. Labels that would sit on top of each other are stacked into one.
- New panel, top right. It reads where price is against last week's value area and tells you the plan:
INSIDE value: sell VAH, buy VAL, take profit at the POC.
ABOVE value: wait for the retest of VAH. If it holds, long.
BELOW value: wait for the retest of VAL. If it holds, short.
- The weekly regime stays as the last line of the panel.
- The panel follows the profile you pick under "Draw the profile of" (last week by default).
Educational tool only. Not financial advice.
Notes de version
v1.2: easier to read.- This year's levels are now dotted and a bit dimmer, so last week's levels stand out. When a yearly level sits right next to a weekly one (like this week's two POCs), you can tell them apart at a glance.
- Labels have a solid background, and prices drop the .00.
- The panel starts straight with INSIDE, ABOVE or BELOW.
Educational tool only. Not financial advice.
Notes de version
v1.3: yearly levels, your choice.New setting under Yearly: "Show the yearly levels".
- Only near price (default): a yearly level shows once recent price action comes within reach of it. Intraday charts stay zoomed in on the candles. On higher timeframes the yearly levels show anyway.
- Always: every yearly level stays on the chart, even far away. Good for planning ahead. On intraday charts TradingView may zoom out to fit them; right-click the price scale and pick "Scale price chart only" to keep the candles big.
Educational tool only. Not financial advice.

Clause de non-responsabilité
Les informations et publications ne sont pas destinées à être, et ne constituent pas, des conseils ou recommandations financiers, d'investissement, de trading ou autres fournis ou approuvés par TradingView. Pour en savoir plus, consultez les Conditions d'utilisation.
Clause de non-responsabilité
Les informations et publications ne sont pas destinées à être, et ne constituent pas, des conseils ou recommandations financiers, d'investissement, de trading ou autres fournis ou approuvés par TradingView. Pour en savoir plus, consultez les Conditions d'utilisation.