OPEN-SOURCE SCRIPT
Mis à jour Micro-Trendline Momentum Breakout [ATR Optimized] (Anant)
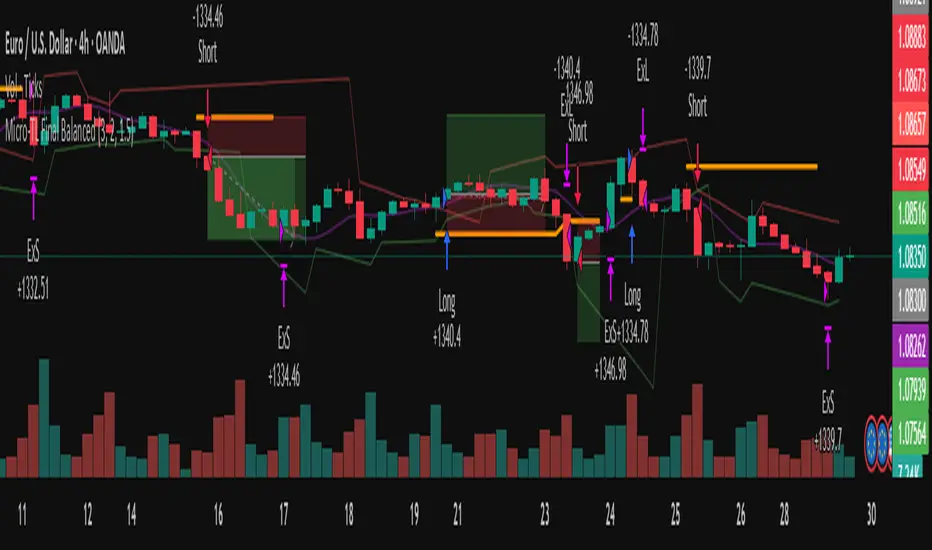
Overview
The Micro-Trendline Momentum Breakout is a systematic trend-following strategy designed for the 4H timeframe. It captures high-probability breakout opportunities from local consolidation structures (micro-trendlines) while utilizing dynamic volatility filtering to avoid "market noise."The core philosophy relies on identifying short-term "spikes" (pivot points) to construct dynamic support and resistance levels. Unlike static horizontal levels, these micro-trendlines adapt to the immediate slope of price action, allowing for earlier entries in emerging trends.
Core Components
Trading Rules
1. Setup (The Trendlines)The script continuously monitors the two most recent High Pivots and Low Pivots. It calculates the slope between these "spikes" and projects an invisible line forward.
2. Long Entry (Buy)Price closes above the projected Resistance Trendline.The current close is above the 20-period HMA (Bullish Bias).RSI is below 70 (Not overextended).
3. Short Entry (Sell)Price closes below the projected Support Trendline.The current close is below the 20-period HMA (Bearish Bias).RSI is above 30 (Not overextended).
4. Risk Management
Stop Loss: Fixed at $1.5 \times \text{ATR}$ from the entry price, providing a "volatility buffer."
Take Profit: Calculated at a 1:2 Risk-to-Reward ratio. This ensures that even with a win rate below 50%, the strategy remains mathematically profitable over a large sample of trades.
Best Markets & Settings
Timeframe:4H (Recommended for balanced signal frequency).
Pairs: Major FX pairs (EURUSD, GBPUSD) and Gold (XAUUSD).
Risk: 1-2% of equity per trade.
Why this strategy works?
Most retail traders draw subjective trendlines. This algorithm removes human bias by calculating the exact geometric slope between pivots. By combining this with an ATR-based exit, the strategy survives "stop hunts" that typical retail traders fall victim to, capturing the meat of the move once the breakout is confirmed.
Disclaimer
Past performance is not indicative of future results. Always backtest on your specific broker's data to account for spread and slippage.
The Micro-Trendline Momentum Breakout is a systematic trend-following strategy designed for the 4H timeframe. It captures high-probability breakout opportunities from local consolidation structures (micro-trendlines) while utilizing dynamic volatility filtering to avoid "market noise."The core philosophy relies on identifying short-term "spikes" (pivot points) to construct dynamic support and resistance levels. Unlike static horizontal levels, these micro-trendlines adapt to the immediate slope of price action, allowing for earlier entries in emerging trends.
Core Components
- Dynamic Structure Detection: Uses a 3-bar pivot lookback to identify "spikes" (local highs/lows).
- Hull Moving Average (HMA 20): Acts as a fast trend filter to ensure the breakout is aligned with immediate market momentum.
- Volatility-Based Protection (ATR): Uses a 1.5x ATR stop loss. This accounts for the specific volatility of the asset (e.g., EURUSD) and prevents premature exits due to minor wicks.
- Overextension Filter (RSI): Prevents "buying the top" or "selling the bottom" by restricting entries when the Relative Strength Index is in overbought or oversold territory.
Trading Rules
1. Setup (The Trendlines)The script continuously monitors the two most recent High Pivots and Low Pivots. It calculates the slope between these "spikes" and projects an invisible line forward.
2. Long Entry (Buy)Price closes above the projected Resistance Trendline.The current close is above the 20-period HMA (Bullish Bias).RSI is below 70 (Not overextended).
3. Short Entry (Sell)Price closes below the projected Support Trendline.The current close is below the 20-period HMA (Bearish Bias).RSI is above 30 (Not overextended).
4. Risk Management
Stop Loss: Fixed at $1.5 \times \text{ATR}$ from the entry price, providing a "volatility buffer."
Take Profit: Calculated at a 1:2 Risk-to-Reward ratio. This ensures that even with a win rate below 50%, the strategy remains mathematically profitable over a large sample of trades.
Best Markets & Settings
Timeframe:4H (Recommended for balanced signal frequency).
Pairs: Major FX pairs (EURUSD, GBPUSD) and Gold (XAUUSD).
Risk: 1-2% of equity per trade.
Why this strategy works?
Most retail traders draw subjective trendlines. This algorithm removes human bias by calculating the exact geometric slope between pivots. By combining this with an ATR-based exit, the strategy survives "stop hunts" that typical retail traders fall victim to, capturing the meat of the move once the breakout is confirmed.
Disclaimer
Past performance is not indicative of future results. Always backtest on your specific broker's data to account for spread and slippage.
Notes de version
//version=5strategy("Micro-TL Final Balanced", overlay=true, initial_capital=10000, default_qty_type=strategy.percent_of_equity, default_qty_value=15)
// --- 1. Inputs ---
pivotLen = input.int(3, "Pivot Strength")
rrRatio = input.float(2.0, "Risk:Reward")
atrMult = input.float(1.5, "ATR Stop Multiplier")
// Fast Trend Filter
hmaFilter = ta.hma(close, 20)
rsi = ta.rsi(close, 14)
// --- 2. Variables ---
var float ph1 = na, var float ph2 = na
var int ph1Idx = na, var int ph2Idx = na
var float pl1 = na, var float pl2 = na
var int pl1Idx = na, var int pl2Idx = na
// --- 3. Spike Detection ---
ph = ta.pivothigh(pivotLen, 1)
pl = ta.pivotlow(pivotLen, 1)
if not na(ph)
ph2 := ph1, ph2Idx := ph1Idx
ph1 := ph, ph1Idx := bar_index - 1
if not na(pl)
pl2 := pl1, pl2Idx := pl1Idx
pl1 := pl, pl1Idx := bar_index - 1
// --- 4. Trendline Calculation ---
resPrice = ph1 + ((ph1 - ph2) / (ph1Idx - ph2Idx) * (bar_index - ph1Idx))
supPrice = pl1 + ((pl1 - pl2) / (pl1Idx - pl2Idx) * (bar_index - pl1Idx))
// --- 5. Balanced Entry Logic ---
longCondition = ta.crossover(close, resPrice) and close > hmaFilter and rsi < 70
shortCondition = ta.crossunder(close, supPrice) and close < hmaFilter and rsi > 30
// --- 6. Execution with ATR Protection ---
atr = ta.atr(14)
var float currentSL = na // Variable to store the SL line
// Clear the SL line from the chart when we are flat and not taking a new trade
if strategy.position_size == 0 and not longCondition and not shortCondition
currentSL := na
if longCondition and strategy.position_size == 0
float sl = close - (atr * atrMult)
currentSL := sl // Save SL for plotting
strategy.entry("Long", strategy.long)
strategy.exit("ExL", "Long", stop=sl, limit=close + ((close-sl) * rrRatio))
if shortCondition and strategy.position_size == 0
float sl = close + (atr * atrMult)
currentSL := sl // Save SL for plotting
strategy.entry("Short", strategy.short)
strategy.exit("ExS", "Short", stop=sl, limit=close - ((sl-close) * rrRatio))
// --- 7. Visuals ---
plot(hmaFilter, color=color.new(color.purple, 50), title="HMA Trend")
plot(resPrice, color=color.new(color.red, 60), style=plot.style_linebr, title="Resistance Line")
plot(supPrice, color=color.new(color.green, 60), style=plot.style_linebr, title="Support Line")
// Plot the Stop Loss line
plot(currentSL, color=color.new(color.orange, 0), style=plot.style_linebr, linewidth=2, title="Active Stop Loss")
Script open-source
Dans l'esprit TradingView, le créateur de ce script l'a rendu open source afin que les traders puissent examiner et vérifier ses fonctionnalités. Bravo à l'auteur! Bien que vous puissiez l'utiliser gratuitement, n'oubliez pas que la republication du code est soumise à nos Règles.

Clause de non-responsabilité
Les informations et publications ne sont pas destinées à être, et ne constituent pas, des conseils ou recommandations financiers, d'investissement, de trading ou autres fournis ou approuvés par TradingView. Pour en savoir plus, consultez les Conditions d'utilisation.
Script open-source
Dans l'esprit TradingView, le créateur de ce script l'a rendu open source afin que les traders puissent examiner et vérifier ses fonctionnalités. Bravo à l'auteur! Bien que vous puissiez l'utiliser gratuitement, n'oubliez pas que la republication du code est soumise à nos Règles.
Clause de non-responsabilité
Les informations et publications ne sont pas destinées à être, et ne constituent pas, des conseils ou recommandations financiers, d'investissement, de trading ou autres fournis ou approuvés par TradingView. Pour en savoir plus, consultez les Conditions d'utilisation.