OPEN-SOURCE SCRIPT
Mis à jour Average Price / Time
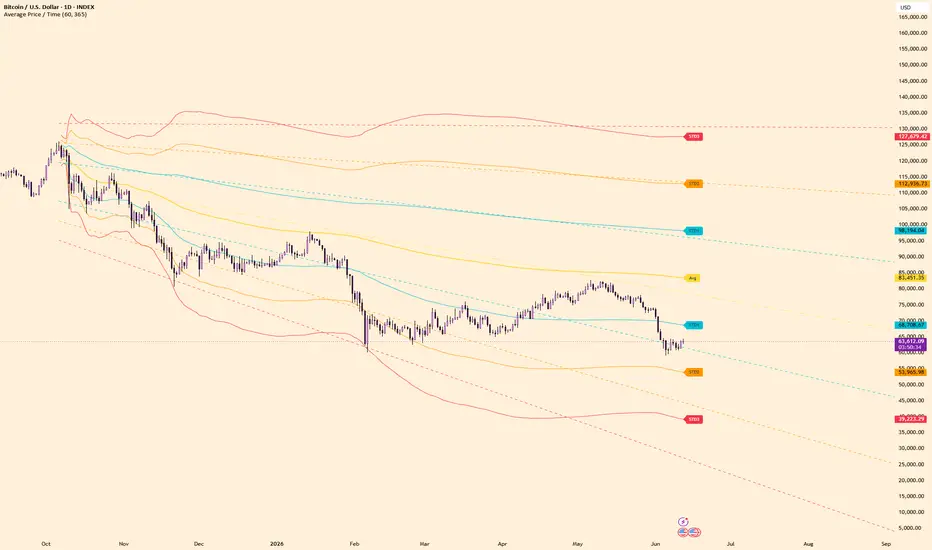
Average Price / Time calculates an anchored time-at-price average from a selected starting candle.
The script uses 1-hour candle ranges by default and treats time as evenly distributed across each candle’s high-low range. From the selected anchor point, it calculates the average price and plots standard deviation bands around it.
Features:
- Mouse-selected start candle
- Time-at-price average
- STD1, STD2, and STD3 bands
- Current z-score shown in the data window
Note:
This is a time-at-price approximation, not a volume-weighted calculation. It measures where price spent time, not where the most volume traded.
The script uses 1-hour candle ranges by default and treats time as evenly distributed across each candle’s high-low range. From the selected anchor point, it calculates the average price and plots standard deviation bands around it.
Features:
- Mouse-selected start candle
- Time-at-price average
- STD1, STD2, and STD3 bands
- Current z-score shown in the data window
Note:
This is a time-at-price approximation, not a volume-weighted calculation. It measures where price spent time, not where the most volume traded.
Notes de version
Added linear-regression projection tools for Avg and standard deviation levels.The indicator now calculates regression slopes for Avg, STD1, STD2, and STD3 levels from the anchored period and draws forward projection lines based on those fitted trends.
Projection length is user configurable, and projected slopes are available in the data window.
Script open-source
Dans l'esprit TradingView, le créateur de ce script l'a rendu open source afin que les traders puissent examiner et vérifier ses fonctionnalités. Bravo à l'auteur! Bien que vous puissiez l'utiliser gratuitement, n'oubliez pas que la republication du code est soumise à nos Règles.

Clause de non-responsabilité
Les informations et publications ne sont pas destinées à être, et ne constituent pas, des conseils ou recommandations financiers, d'investissement, de trading ou autres fournis ou approuvés par TradingView. Pour en savoir plus, consultez les Conditions d'utilisation.
Script open-source
Dans l'esprit TradingView, le créateur de ce script l'a rendu open source afin que les traders puissent examiner et vérifier ses fonctionnalités. Bravo à l'auteur! Bien que vous puissiez l'utiliser gratuitement, n'oubliez pas que la republication du code est soumise à nos Règles.
Clause de non-responsabilité
Les informations et publications ne sont pas destinées à être, et ne constituent pas, des conseils ou recommandations financiers, d'investissement, de trading ou autres fournis ou approuvés par TradingView. Pour en savoir plus, consultez les Conditions d'utilisation.