Wick Pressure Zones [BigBeluga]
More exclusive indicators from BigBeluga
Subscribe to BigBeluga Premium for $66.47/month to get exclusive indicators by this author. You pay right on TradingView and can use them on your charts straight away.
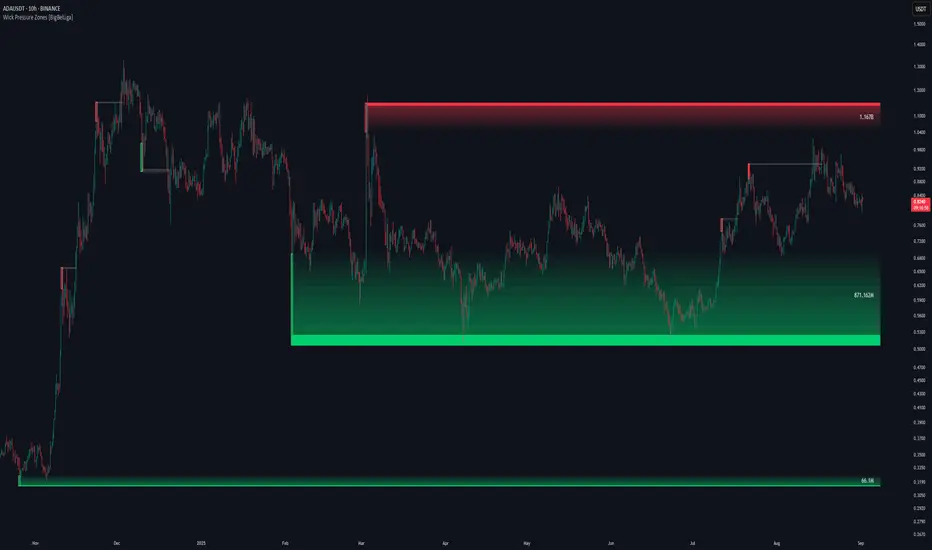
Explore BigBeluga PremiumThe Wick Pressure Zones [BigBeluga] indicator highlights areas where extreme wick activity occurred, signaling strong buy or sell pressure. By measuring unusually long upper or lower wicks and mapping them into gradient volume zones, the tool helps traders identify levels where liquidity was absorbed, leaving behind footprints of supply and demand imbalances. These zones often act as support, resistance, or liquidity sweep magnets.
🔵 CONCEPTS
- Extreme Wicks: Large upper or lower shadows indicate aggressive rejection — upper wicks suggest selling pressure, lower wicks suggest buying pressure.
- Volumatic Gradient Zones: From each detected wick, the indicator projects a layered gradient zone, proportional to the wick’s size, showing where most pressure occurred.
- Liquidity Footprints: These zones mark levels where significant buy/sell volume was executed, often becoming reaction points on future retests.
- Automatic Expiration: Zones persist until price decisively trades through them, after which they are cleared to keep the chart clean.
🔵 FEATURES
- Automatic Wick Detection: Identifies extreme upper and lower wick events using percentile filtering and Realative Strength Index.
- Gradient Zone Visualization: Builds a 10-layer zone from the wick top/bottom, shading intensity according to pressure strength.
- Volume Labels: Each zone is annotated with the bar’s volume at the origin point for added context.
- Dynamic Zone Extension: Zones extend to the right as long as they remain relevant; once price closes through them, they are removed.
- Support & Resistance Mapping: Upper wick zones (red) behave like supply/resistance, lower wick zones (green) like demand/support.
- Clutter Control: Limits the number of active zones (default 10) to keep charts responsive.
- Background Highlighting: Optional background shading when new wick zones appear (red for sell, green for buy).
🔵 HOW TO USE
- Look for Upper Wick Zones (red): Indicate strong selling pressure; watch for resistance, reversals, or liquidity sweeps above.
- Look for Lower Wick Zones (green): Indicate strong buying pressure; watch for support or liquidity sweeps below.
- Trade Retests: When price returns to a zone, expect a reaction (bounce or rejection) due to leftover liquidity.
- Combine with Context: Align wick pressure zones with HTF support/resistance, order blocks, or volume profile for stronger signals.
- Use Volume Labels: High-volume wicks indicate more significant liquidity events, making the zone more likely to act as a strong reaction point.
🔵 CONCLUSION
The Wick Pressure Zones [BigBeluga] is a powerful way to visualize hidden liquidity and aggressive rejections. By mapping extreme wick events into dynamic, volume-annotated zones, it shows traders where the market absorbed heavy buy/sell pressure. These levels frequently act as magnets or turning points, making them valuable for timing entries, stop placement, or fade strategies.

🌐 bigbeluga.org/tv - Get access to our powerful tools & indicators.
🔵 Learn More -> docs.bigbeluga.org/
🔵 Join Discord -> go.bigbeluga.org/k65q9bfqfu
All content provided by BigBeluga is for educational purposes only
🔵 Learn More -> docs.bigbeluga.org/
🔵 Join Discord -> go.bigbeluga.org/k65q9bfqfu
All content provided by BigBeluga is for educational purposes only
Clause de non-responsabilité
Les informations et publications ne sont pas destinées à être, et ne constituent pas, des conseils ou recommandations financiers, d'investissement, de trading ou autres fournis ou approuvés par TradingView. Pour en savoir plus, consultez les Conditions d'utilisation.