OPEN-SOURCE SCRIPT
Auto Structure Lines
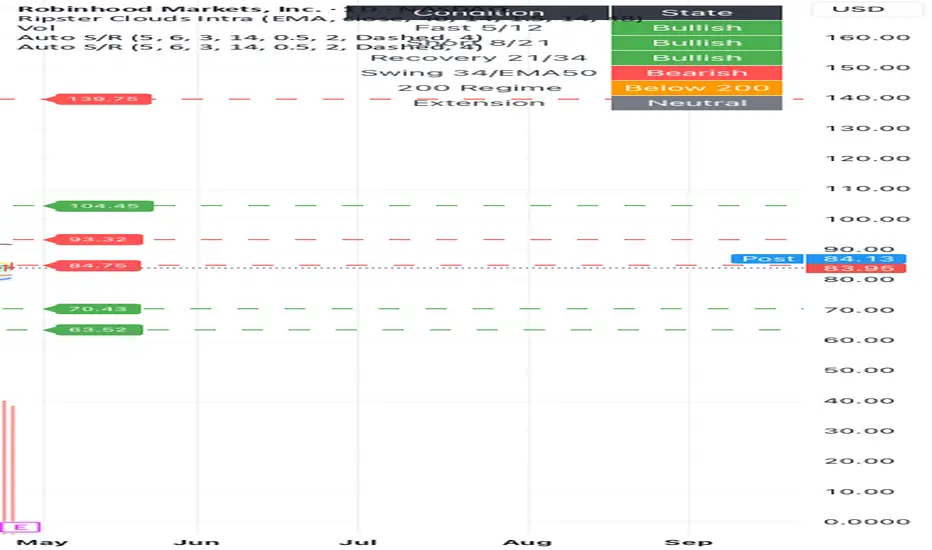
Auto Structure Lines automatically detects recent swing highs and swing lows, then plots clean support and resistance levels on the chart. It is designed to help traders quickly identify nearby structure, breakout areas, rejection zones, and possible pullback levels without manually drawing every line.
The indicator uses confirmed pivot highs and lows to create resistance and support lines. Nearby levels are merged using an ATR-based tolerance so the chart stays cleaner and avoids stacking multiple lines around the same price area.
Key features:
Automatically detects pivot-based support and resistance
Extends structure lines to the right side of the chart
Stores multiple historical levels while showing only the most recent visible levels
ATR-based level merging to reduce clutter
Optional price labels for each visible level
Customizable pivot length, line style, colors, width, and label offset
Separate toggles for support and resistance
This tool is useful for identifying important price areas, planning breakout entries, watching retests, and managing risk around nearby support or resistance.
Auto Structure Lines is a visual decision-support tool. It does not generate buy or sell signals by itself and should be used with price action, volume, trend context, and your own risk management.
Script open-source
Dans l'esprit TradingView, le créateur de ce script l'a rendu open source afin que les traders puissent examiner et vérifier ses fonctionnalités. Bravo à l'auteur! Bien que vous puissiez l'utiliser gratuitement, n'oubliez pas que la republication du code est soumise à nos Règles.

Clause de non-responsabilité
Les informations et publications ne sont pas destinées à être, et ne constituent pas, des conseils ou recommandations financiers, d'investissement, de trading ou autres fournis ou approuvés par TradingView. Pour en savoir plus, consultez les Conditions d'utilisation.
Script open-source
Dans l'esprit TradingView, le créateur de ce script l'a rendu open source afin que les traders puissent examiner et vérifier ses fonctionnalités. Bravo à l'auteur! Bien que vous puissiez l'utiliser gratuitement, n'oubliez pas que la republication du code est soumise à nos Règles.
Clause de non-responsabilité
Les informations et publications ne sont pas destinées à être, et ne constituent pas, des conseils ou recommandations financiers, d'investissement, de trading ou autres fournis ou approuvés par TradingView. Pour en savoir plus, consultez les Conditions d'utilisation.