OPEN-SOURCE SCRIPT
Polarity Divergence Scanner [JOAT]
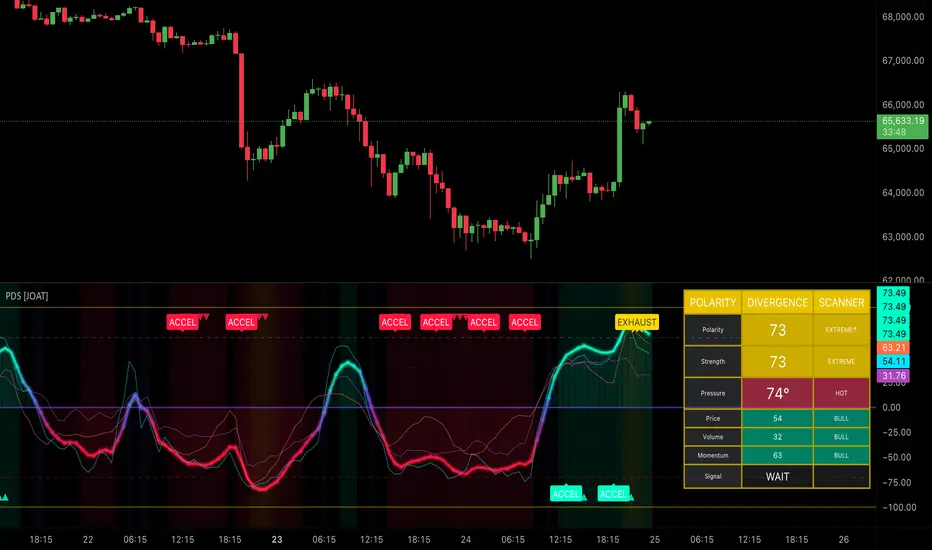
Polarity Divergence Scanner [JOAT]
Introduction
The Polarity Divergence Scanner is an open-source advanced market polarity detection system that measures bullish and bearish pressure across four distinct market dimensions: price action, volume flow, momentum dynamics, and volatility expansion. This sophisticated oscillator integrates multiple pressure measurement techniques to detect polarity shifts, divergences, and pressure extremes with visual heatmap representation.
The indicator is designed for traders who understand that market movements are driven by the constant battle between bullish and bearish forces across multiple dimensions. By synthesizing price polarity, volume polarity, momentum polarity, and volatility polarity into a composite index, this tool helps identify structural market turning points where pressure imbalances create high-probability reversal opportunities.
Why This Integration Exists
This indicator combines four distinct polarity measurement frameworks that complement each other:
Each component addresses different aspects of market pressure dynamics. Price polarity reveals directional bias, volume polarity shows institutional flow, momentum polarity indicates acceleration changes, and volatility polarity measures market energy. Together, they create a comprehensive view of market pressure that traditional single-dimension indicators cannot provide.

Core Components Explained
1. Price Polarity Engine
Measures directional pressure from price movement:
Pine Script®
This calculation normalizes price movement against the recent range, providing a -100 to +100 scale where positive values indicate bullish pressure and negative values indicate bearish pressure.
2. Volume Polarity System
Analyzes buying versus selling pressure through volume flow:
Pine Script®
This reveals institutional flow direction by comparing accumulation (buying) volume against distribution (selling) volume over the specified period.
3. Momentum Polarity Calculator
Combines RSI and MACD for comprehensive momentum analysis:
Pine Script®
This dual-momentum approach captures both relative strength (RSI) and trend acceleration (MACD) components.
4. Volatility Polarity Tracker
Measures expansion versus contraction pressure:
Pine Script®
Positive values indicate expanding volatility (energy building), while negative values show contracting volatility (energy dissipating).
5. Composite Polarity Index
Weighted combination of all polarity dimensions:
Pine Script®
The weighting emphasizes price and momentum while incorporating volume flow and volatility context.
6. Pressure Zone Classification
The system defines seven distinct pressure zones:
7. Polarity Shift Detection
The system identifies four types of polarity shifts:
Polarity Flips: Crosses zero line with sufficient strength (>30)
Polarity Acceleration: Increasing momentum in extreme zones (>50 or <-50)
Polarity Exhaustion: Weakening momentum in extreme zones (>80 or <-80)
Pressure Temperature: Volatility-adjusted intensity measurement
8. Advanced Divergence Detection
Uses pivot-based analysis to identify polarity divergences:
Bullish Polarity Divergence: Price makes lower low while polarity makes higher low
Bearish Polarity Divergence: Price makes higher high while polarity makes lower high
Divergences are filtered by minimum polarity strength to ensure significance.
Visual Elements
How Components Work Together
The integration creates a multi-dimensional pressure analysis:
Layer 1 - Price Pressure: Directional bias from pure price movement
Layer 2 - Volume Pressure: Institutional flow through buying/selling volume
Layer 3 - Momentum Pressure: Acceleration and relative strength dynamics
Layer 4 - Volatility Pressure: Energy expansion/contraction context
Layer 5 - Composite Analysis: Weighted combination revealing overall market polarity
Layer 6 - Shift Detection: Identification of polarity transitions and extremes
Layer 7 - Divergence Analysis: Price-polarity disconnects signaling potential reversals
Example scenario: Price makes a new high (Layer 1) but volume polarity weakens (Layer 2), momentum polarity diverges (Layer 3), and volatility contracts (Layer 4). The composite polarity (Layer 5) shows bearish divergence (Layer 7) with exhaustion signals (Layer 6), indicating high reversal probability.

Input Parameters
Polarity Core:
Divergence Detection:
Visual Settings:
How to Use This Indicator
Step 1: Assess Overall Polarity
Check the composite polarity level and current pressure zone classification in the dashboard.
Step 2: Identify Pressure Extremes
Look for extreme bull (>70) or extreme bear (<-70) zones where reversals are more likely.
Step 3: Monitor Polarity Shifts
Watch for polarity flips (zero line crosses), acceleration in extreme zones, or exhaustion signals.
Step 4: Analyze Component Divergences
Check if individual polarity components (price, volume, momentum) are aligned or diverging.
Step 5: Detect Polarity Divergences
Look for diamond markers indicating price-polarity divergences - these often precede major reversals.
Step 6: Confirm with Pressure Temperature
High pressure temperature (volatility-adjusted intensity) adds conviction to polarity signals.
Step 7: Wait for Confluence
Best setups occur when multiple factors align: extreme zones + polarity shifts + divergences + high temperature.
Best Practices
Indicator Limitations
Technical Implementation
Built with Pine Script v6 using:
The code is fully open-source and can be modified to suit individual trading styles and preferences.
Originality Statement
This indicator is original in its multi-dimensional polarity approach. While individual components (RSI, MACD, volume analysis, ATR) are established concepts, this integration is justified because:
Each component contributes unique polarity information: price polarity shows directional bias, volume polarity reveals institutional flow, momentum polarity indicates acceleration, and volatility polarity measures energy. The integration's value lies in identifying moments when these pressure dimensions align or diverge, creating high-probability trading opportunities.
Disclaimer
This indicator is provided for educational and informational purposes only. It is not financial advice or a recommendation to buy or sell any financial instrument. Trading involves substantial risk of loss and is not suitable for all investors.
Polarity analysis and divergence detection are analytical concepts that do not guarantee future price movement. Past performance and backtested results do not guarantee future results. Market conditions change, and polarity patterns that worked historically may not work in the future.
Always use proper risk management, including stop losses and position sizing appropriate for your account size and risk tolerance. Never risk more than you can afford to lose. Consider consulting with a qualified financial advisor before making investment decisions.
The author is not responsible for any losses incurred from using this indicator. Users assume full responsibility for all trading decisions made using this tool.
-Made with passion by officialjackofalltrades
Introduction
The Polarity Divergence Scanner is an open-source advanced market polarity detection system that measures bullish and bearish pressure across four distinct market dimensions: price action, volume flow, momentum dynamics, and volatility expansion. This sophisticated oscillator integrates multiple pressure measurement techniques to detect polarity shifts, divergences, and pressure extremes with visual heatmap representation.
The indicator is designed for traders who understand that market movements are driven by the constant battle between bullish and bearish forces across multiple dimensions. By synthesizing price polarity, volume polarity, momentum polarity, and volatility polarity into a composite index, this tool helps identify structural market turning points where pressure imbalances create high-probability reversal opportunities.
Why This Integration Exists
This indicator combines four distinct polarity measurement frameworks that complement each other:
- Price Polarity Analysis: Measures directional pressure from pure price action using range-normalized calculations
- Volume Polarity Tracking: Analyzes buying versus selling pressure through volume flow dynamics
- Momentum Polarity Detection: Combines RSI and MACD analysis to measure acceleration-based pressure
- Volatility Polarity Assessment: Tracks expansion versus contraction pressure through ATR analysis
Each component addresses different aspects of market pressure dynamics. Price polarity reveals directional bias, volume polarity shows institutional flow, momentum polarity indicates acceleration changes, and volatility polarity measures market energy. Together, they create a comprehensive view of market pressure that traditional single-dimension indicators cannot provide.
Core Components Explained
1. Price Polarity Engine
Measures directional pressure from price movement:
This calculation normalizes price movement against the recent range, providing a -100 to +100 scale where positive values indicate bullish pressure and negative values indicate bearish pressure.
2. Volume Polarity System
Analyzes buying versus selling pressure through volume flow:
This reveals institutional flow direction by comparing accumulation (buying) volume against distribution (selling) volume over the specified period.
3. Momentum Polarity Calculator
Combines RSI and MACD for comprehensive momentum analysis:
This dual-momentum approach captures both relative strength (RSI) and trend acceleration (MACD) components.
4. Volatility Polarity Tracker
Measures expansion versus contraction pressure:
Positive values indicate expanding volatility (energy building), while negative values show contracting volatility (energy dissipating).
5. Composite Polarity Index
Weighted combination of all polarity dimensions:
The weighting emphasizes price and momentum while incorporating volume flow and volatility context.
6. Pressure Zone Classification
The system defines seven distinct pressure zones:
- Extreme Bull Zone: Polarity ≥ 70 (Intense bullish pressure)
- Strong Bull Zone: Polarity 40-69 (Solid bullish pressure)
- Weak Bull Zone: Polarity 1-39 (Mild bullish pressure)
- Neutral Zone: Polarity = 0 (Equilibrium state)
- Weak Bear Zone: Polarity -1 to -39 (Mild bearish pressure)
- Strong Bear Zone: Polarity -40 to -69 (Solid bearish pressure)
- Extreme Bear Zone: Polarity ≤ -70 (Intense bearish pressure)
7. Polarity Shift Detection
The system identifies four types of polarity shifts:
Polarity Flips: Crosses zero line with sufficient strength (>30)
Polarity Acceleration: Increasing momentum in extreme zones (>50 or <-50)
Polarity Exhaustion: Weakening momentum in extreme zones (>80 or <-80)
Pressure Temperature: Volatility-adjusted intensity measurement
8. Advanced Divergence Detection
Uses pivot-based analysis to identify polarity divergences:
Bullish Polarity Divergence: Price makes lower low while polarity makes higher low
Bearish Polarity Divergence: Price makes higher high while polarity makes lower high
Divergences are filtered by minimum polarity strength to ensure significance.
Visual Elements
- Composite Polarity Wave: Main oscillator with advanced gradient coloring and triple-layer glow effect
- Individual Polarity Lines: Price, volume, and momentum polarity components
- Polarity Strength Histogram: Background columns showing absolute polarity strength
- Pressure Zone Backgrounds: Dynamic gradient backgrounds based on polarity intensity
- Reference Lines: Critical levels at ±40, ±70, and ±100 with neutral zone highlighting
- Polarity Shift Markers: Circles for flips, triangles for acceleration, X-crosses for exhaustion
- Divergence Diamonds: Large diamond markers for confirmed polarity divergences
- Dashboard: Comprehensive real-time display of all polarity components and signal status
How Components Work Together
The integration creates a multi-dimensional pressure analysis:
Layer 1 - Price Pressure: Directional bias from pure price movement
Layer 2 - Volume Pressure: Institutional flow through buying/selling volume
Layer 3 - Momentum Pressure: Acceleration and relative strength dynamics
Layer 4 - Volatility Pressure: Energy expansion/contraction context
Layer 5 - Composite Analysis: Weighted combination revealing overall market polarity
Layer 6 - Shift Detection: Identification of polarity transitions and extremes
Layer 7 - Divergence Analysis: Price-polarity disconnects signaling potential reversals
Example scenario: Price makes a new high (Layer 1) but volume polarity weakens (Layer 2), momentum polarity diverges (Layer 3), and volatility contracts (Layer 4). The composite polarity (Layer 5) shows bearish divergence (Layer 7) with exhaustion signals (Layer 6), indicating high reversal probability.
Input Parameters
Polarity Core:
- Polarity Period: Base period for polarity calculations (default: 14)
- Smoothing: Smoothing factor for polarity waves (default: 3)
- Sensitivity: Signal sensitivity multiplier (default: 1.5)
Divergence Detection:
- Pivot Lookback: Bars for pivot detection (default: 5)
- Min Divergence Strength: Minimum polarity strength for signals (default: 60)
Visual Settings:
- Show Polarity Waves: Toggle main polarity display
- Show Pressure Zones: Toggle background zone coloring
- Show Divergence Markers: Toggle divergence signals
- Show Polarity Shifts: Toggle shift detection markers
How to Use This Indicator
Step 1: Assess Overall Polarity
Check the composite polarity level and current pressure zone classification in the dashboard.
Step 2: Identify Pressure Extremes
Look for extreme bull (>70) or extreme bear (<-70) zones where reversals are more likely.
Step 3: Monitor Polarity Shifts
Watch for polarity flips (zero line crosses), acceleration in extreme zones, or exhaustion signals.
Step 4: Analyze Component Divergences
Check if individual polarity components (price, volume, momentum) are aligned or diverging.
Step 5: Detect Polarity Divergences
Look for diamond markers indicating price-polarity divergences - these often precede major reversals.
Step 6: Confirm with Pressure Temperature
High pressure temperature (volatility-adjusted intensity) adds conviction to polarity signals.
Step 7: Wait for Confluence
Best setups occur when multiple factors align: extreme zones + polarity shifts + divergences + high temperature.
Best Practices
- Use on 15-minute to 4-hour timeframes for optimal polarity detection
- Focus on extreme zones (>70 or <-70) for highest probability reversals
- Polarity flips provide early trend change signals with good risk:reward
- Divergences in extreme zones offer exceptional reversal opportunities
- Acceleration signals in extreme zones often precede explosive moves
- Exhaustion signals warn of potential polarity reversals before they occur
- High pressure temperature adds conviction to all polarity signals
- Component analysis helps understand the source of polarity changes
Indicator Limitations
- Polarity can remain extreme longer than expected during strong trends
- Divergences may take time to resolve - patience is required
- Extreme zones don't guarantee immediate reversals - timing is crucial
- Component polarity may conflict, requiring interpretation skills
- Pressure temperature can spike during news events, creating false signals
- Polarity shifts may be brief and require quick decision-making
- Performance varies across different market conditions and volatility regimes
- Requires understanding of multi-dimensional pressure analysis concepts
Technical Implementation
Built with Pine Script v6 using:
- Multi-dimensional polarity calculation across four market aspects
- Advanced gradient coloring system with triple-layer glow effects
- Pivot-based divergence detection with strength filtering
- Dynamic pressure zone classification with background visualization
- Real-time polarity shift detection with multiple signal types
- Comprehensive dashboard with component breakdown and signal status
- Anti-overlap filtering to prevent signal clustering
- Pressure temperature calculation for volatility-adjusted intensity
The code is fully open-source and can be modified to suit individual trading styles and preferences.
Originality Statement
This indicator is original in its multi-dimensional polarity approach. While individual components (RSI, MACD, volume analysis, ATR) are established concepts, this integration is justified because:
- It synthesizes four distinct polarity dimensions that address different market pressure aspects
- The composite polarity index provides a unified view of market pressure across multiple dimensions
- Advanced polarity shift detection identifies transitions before they become obvious in price
- Polarity divergence analysis reveals price-pressure disconnects that traditional indicators miss
- Pressure zone classification provides quantitative framework for market state assessment
- Pressure temperature adds volatility context to polarity intensity measurements
Each component contributes unique polarity information: price polarity shows directional bias, volume polarity reveals institutional flow, momentum polarity indicates acceleration, and volatility polarity measures energy. The integration's value lies in identifying moments when these pressure dimensions align or diverge, creating high-probability trading opportunities.
Disclaimer
This indicator is provided for educational and informational purposes only. It is not financial advice or a recommendation to buy or sell any financial instrument. Trading involves substantial risk of loss and is not suitable for all investors.
Polarity analysis and divergence detection are analytical concepts that do not guarantee future price movement. Past performance and backtested results do not guarantee future results. Market conditions change, and polarity patterns that worked historically may not work in the future.
Always use proper risk management, including stop losses and position sizing appropriate for your account size and risk tolerance. Never risk more than you can afford to lose. Consider consulting with a qualified financial advisor before making investment decisions.
The author is not responsible for any losses incurred from using this indicator. Users assume full responsibility for all trading decisions made using this tool.
-Made with passion by officialjackofalltrades
Script open-source
Dans l'esprit TradingView, le créateur de ce script l'a rendu open source afin que les traders puissent examiner et vérifier ses fonctionnalités. Bravo à l'auteur! Bien que vous puissiez l'utiliser gratuitement, n'oubliez pas que la republication du code est soumise à nos Règles.

The Institutional Grade Trading Ecosystem, Built to win trades 📈
Get Access 👇
jackofalltrades.vip 🌐
t.me/jackofalltradesvip 🃏
Get Access 👇
jackofalltrades.vip 🌐
t.me/jackofalltradesvip 🃏
Clause de non-responsabilité
Les informations et publications ne sont pas destinées à être, et ne constituent pas, des conseils ou recommandations financiers, d'investissement, de trading ou autres fournis ou approuvés par TradingView. Pour en savoir plus, consultez les Conditions d'utilisation.
Script open-source
Dans l'esprit TradingView, le créateur de ce script l'a rendu open source afin que les traders puissent examiner et vérifier ses fonctionnalités. Bravo à l'auteur! Bien que vous puissiez l'utiliser gratuitement, n'oubliez pas que la republication du code est soumise à nos Règles.
The Institutional Grade Trading Ecosystem, Built to win trades 📈
Get Access 👇
jackofalltrades.vip 🌐
t.me/jackofalltradesvip 🃏
Get Access 👇
jackofalltrades.vip 🌐
t.me/jackofalltradesvip 🃏
Clause de non-responsabilité
Les informations et publications ne sont pas destinées à être, et ne constituent pas, des conseils ou recommandations financiers, d'investissement, de trading ou autres fournis ou approuvés par TradingView. Pour en savoir plus, consultez les Conditions d'utilisation.