Mis à jour
Trend Indicator A + VWAP Band 3 Can
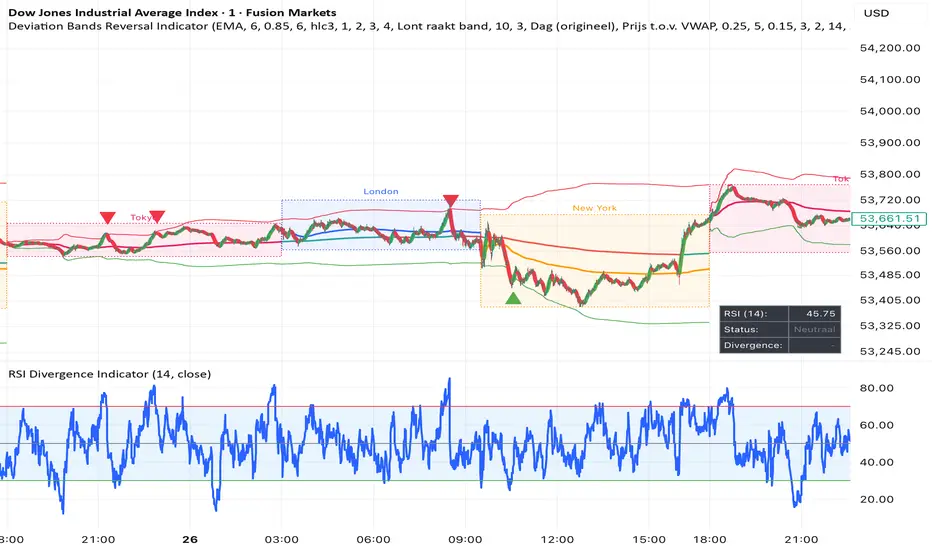
New York Session VWAP with Dynamic Deviation Bands
Overview
This indicator is specifically designed for intraday traders looking to capitalize on the high volatility, volume, and momentum generated during the New York market session open. By combining the Volume Weighted Average Price (VWAP) with customizable deviation bands, this tool helps traders identify key institutional liquidity pools, dynamic support/resistance levels, and high-probability mean-reversion or breakout setups.
Key Features
Session-Optimized Logic: Tailored to track price action accurately around the New York opening bell (15:30 CET / 14:30 CET winter time), filtering out low-volume pre-market noise.
Dynamic Deviation Bands: Multi-layered bands act as volatility-adjusted overbought and oversold zones, adapting instantly to sudden market expansions.
Intraday Precision: Ideal for scalping and day trading highly liquid instruments such as market indices (NAS100, US30) and commodities (XAUUSD).
How to Use & Trade Setup
Mean Reversion (The Fade): Look for price exhaustion at the outer deviation bands during the initial New York open rush. A rejection candle at these extremes often signals a high-probability retracement back to the VWAP baseline.
Trend Following (The Breakout): If price breaks and closes decisively outside the first deviation band with strong volume during the first hour of the NY session, it often validates a strong institutional trend.
VWAP Cross: Use the central VWAP line as a dynamic bias filter. Trading above the VWAP indicates bullish sentiment, while trading below indicates bearish control.
Disclaimer: This indicator is for educational and analysis purposes only. Always combine technical indicators with strict risk management and a defined trading plan.
Overview
This indicator is specifically designed for intraday traders looking to capitalize on the high volatility, volume, and momentum generated during the New York market session open. By combining the Volume Weighted Average Price (VWAP) with customizable deviation bands, this tool helps traders identify key institutional liquidity pools, dynamic support/resistance levels, and high-probability mean-reversion or breakout setups.
Key Features
Session-Optimized Logic: Tailored to track price action accurately around the New York opening bell (15:30 CET / 14:30 CET winter time), filtering out low-volume pre-market noise.
Dynamic Deviation Bands: Multi-layered bands act as volatility-adjusted overbought and oversold zones, adapting instantly to sudden market expansions.
Intraday Precision: Ideal for scalping and day trading highly liquid instruments such as market indices (NAS100, US30) and commodities (XAUUSD).
How to Use & Trade Setup
Mean Reversion (The Fade): Look for price exhaustion at the outer deviation bands during the initial New York open rush. A rejection candle at these extremes often signals a high-probability retracement back to the VWAP baseline.
Trend Following (The Breakout): If price breaks and closes decisively outside the first deviation band with strong volume during the first hour of the NY session, it often validates a strong institutional trend.
VWAP Cross: Use the central VWAP line as a dynamic bias filter. Trading above the VWAP indicates bullish sentiment, while trading below indicates bearish control.
Disclaimer: This indicator is for educational and analysis purposes only. Always combine technical indicators with strict risk management and a defined trading plan.
Notes de version
Functionally they're the same indicator — every input (MA type, VWAP settings, arrow size, filters) stayed identical. The difference is two under-the-hood fixes, plus a new chart label.The old script (published July 8, "Trend A 1M Handmatig") had two bugs causing unreliable Band 3 arrows. First, an arrow could briefly appear on a still-forming candle and then disappear again once that candle closed ("repainting"), because the Heikin Ashi trend was fetched via a separate data request. Second, Band 3 was always treated as "touched" on the very first candle of every session, because the band exactly coincided with the VWAP line at that point — causing false signals right after session start.
The new script ("Trend A Fix backup", to be published as "Hcank99 Indicator Deviation Bands Reversal") now calculates the Heikin Ashi trend directly without a separate data request, so arrows can no longer vanish after a candle closes. It also only counts a band touch once a few candles have passed since session start, removing that false first-candle touch. All plots, colors, and the VWAP/Band 3 lines look the same — only the reliability of the buy/sell arrows has improved.
Notes de version
PictureNotes de version
Hier is een Engelse tekst die je kunt gebruiken voor je release notes / changelog op TradingView:Update — signal reliability fixes
This update addresses inconsistent Band 3 arrows without changing any of the indicator's original inputs or visual style.
Fix 1 — No more disappearing arrows. The 1-timeframe trend calculation now runs natively on the chart's own data instead of through a separate security request. Previously, an arrow could briefly appear on a still-forming candle and then vanish once that candle closed. Arrows are now stable once printed.
Fix 2 — No more false touches at session start. Band 3 is calculated from a running variance that starts at zero on the first candle of each session, which meant the band briefly collapsed onto the VWAP line and registered a false "touch" right after every session open. A touch is now only counted once a configurable number of candles (default: 3) have passed since session start, and the lookback window no longer bleeds over from the previous session.
New optional setting — wick vs. close confirmation. A new toggle, "Require candle close beyond Band 3 (instead of wick)," lets you choose how a band touch is defined. Off by default (original behavior): any wick touching the band counts. On: the candle must actually close on or beyond the band before it counts as a valid touch.
All other logic is unchanged: an arrow still fires when a valid Band 3 touch is followed by a trend reversal within the lookback window, and all existing inputs (MA type, band multiplier, ATR/MTF filters, arrow size, line thickness) work exactly as before.
Notes de version
Bug FixesNotes de version
UPDATE — VWAP trend colouringThe VWAP midline is no longer a fixed colour. It now reflects the trend:
GREEN uptrend
RED downtrend
BLUE no clear direction
The colour is evaluated on every bar, so the line changes at the bar where
the shift happens rather than a few bars later.
HOW THE DIRECTION IS DECIDED
Three modes, under "VWAP Trend Colour":
Price vs VWAP (default)
Red while price trades below the VWAP, green while it trades above.
This tracks the direction of the MARKET and is what most people
actually want to see.
VWAP slope
Follows the tilt of the line itself. Useful, but read the note below
before you rely on it.
Slope + price
Both must agree. Fewest colour changes, slightly later signals.
A NOTE ON SLOPE MODE AND DAY-ANCHORED VWAP
A day-anchored VWAP is the average of everything since the open. By the
middle of the session it holds hundreds of bars, so a single new bar barely
moves it. The line flattens out on its own — even during a strong trend.
In slope mode that reads as "no direction" and the line turns blue while
price is clearly still trending. This is not a bug; it is what a daily
VWAP does.
Two ways around it:
- use Price vs VWAP mode, or
- set VWAP anchor to Session open, which restarts the VWAP at each
session and keeps it responsive.
SETTINGS
Price buffer (ATR) How far price must sit from the VWAP before the
colour commits. Stops the flicker when price is
sitting right on the line. Default 0.25.
Slope window / dead zone
Total VWAP movement across the window, measured
in ATR. Because it is normalised by ATR, the same
value works on EURUSD, XAUUSD, NAS100 and US30.
Hold colour in the neutral zone
On: once red it stays red until price genuinely
crosses to the other side, giving long unbroken
blocks of colour. Off: anything unclear turns blue.
Warm-up bars The first bars after a session or day reset stay
blue. Right after an open there is too little
volume in the VWAP for the reading to mean much.
Colours, line width, optional glow — all adjustable.
NEW ALERTS
VWAP turns up — uptrend starting
VWAP turns down — downtrend starting
VWAP goes flat — direction fading
DATA WINDOW
Two read-only values were added for tuning:
VWAP direction (1 up / 0 flat / -1 down)
Distance from price to VWAP, in ATR
Watch the second one in a quiet market. If it hovers between -0.2 and +0.2,
your 0.25 buffer is set about right.
UNCHANGED
Entry rules, deviation bands, RSI filter, session markers and all existing
alerts work exactly as before. Nothing about signal generation was touched.
Notes de version
UPDATE — Session range boxesEach trading session now draws its own box marking the high and low of
that session. The box expands as the session runs and freezes once it
closes, so you can see at a glance where Asia, London and New York put
their boundaries.
Asia pink (label defaults to "Tokyo")
London blue
New York orange
All three colours and labels are editable. If you prefer "Asia" over
"Tokyo", or want different colours, they are plain input fields.
SETTINGS — "Session ranges"
Draw session ranges as a box Master switch.
Session name above the box Places the label above the high,
centred over the session.
Sessions to keep How many boxes stay on the chart before
the oldest are removed. Default 12, which
is roughly four days. Higher values keep
more history, but TradingView caps a
script at 500 boxes.
Fill transparency Higher is lighter. At 100 only the
dotted border remains.
ALSO CHANGED
The old AS Start / LN Start / NY Start labels along the top of the chart
are now OFF by default. With the boxes drawn they were duplicating the same
information. The setting is still there if you want them back.
If you were running a separate session-range indicator alongside this one,
you can remove it now.
UNCHANGED
Entry rules, deviation bands, RSI filter, VWAP trend colouring and every
existing alert behave exactly as before. The boxes are drawn from the same
session definitions the script already used, so nothing about signal
generation was touched.
Notes de version
Title name changeNotes de version
This indicator is a complete, all-in-one suite designed to spot high-probability trend reversals using a powerful combination of VWAP Deviation Bands, Multi-Timeframe Trend tracking, and RSI Divergence.
In this latest major update, we have completely integrated the RSI into the main chart, eliminating the need for a separate oscillator pane!
🔥 What's New in this Version?
On-Chart RSI Dashboard: A sleek, fully customizable table on your main chart (choose your preferred corner) that displays the real-time RSI value, its current status (Overbought/Oversold), and recent Divergence signals at a glance.
Smart RSI Divergence Detection: The script now automatically detects both Bullish and Bearish RSI Divergences. It draws clean, dashed trendlines directly on your chart to visually connect the price pivots.
Advanced Divergence Filtering: You can now set the indicator to only fire Buy/Sell arrows if a divergence is detected and the RSI has recently touched your Overbought or Oversold zones. This filters out massive amounts of market noise.
🛠️ Core Features:
Dynamic Session Boxes: Automatically draws clean, shaded boxes around the Asian, London, and New York sessions, highlighting the high and low of each session as it develops. Old boxes are automatically cleaned up to keep your chart tidy.
Trend-Colored VWAP: The VWAP line changes color dynamically based on the trend direction (Green = Uptrend, Red = Downtrend, Blue = Ranging/Flat). You can base this on the price relative to the VWAP, the actual slope of the VWAP, or both!
Deviation Reversal Bands: Uses Standard Deviation multiplier bands mapped to the VWAP to find extreme over-extensions in price.
Sniper Entry Signals: Buy (Green) and Sell (Red) arrows appear only when multiple conditions align: Trend reversal, Deviation band touch/rejection, and extreme RSI/Divergence conditions.
Multi-Timeframe (MTF) & ATR Filters: Optional built-in filters allow you to demand higher-timeframe trend confirmation (e.g., 3-minute trend direction) and minimum volatility (ATR) before a signal is printed.
How to use it:
Look for confluence. The best signals occur when the price pushes outside the outer VWAP Deviation Bands, the RSI Dashboard flashes Overbought/Oversold, a Divergence is spotted, and the micro-trend indicator flips direction.
(Fully customizable: Colors, lengths, multipliers, and session times can all be adjusted in the settings menu to fit your personal trading style and preferred assets.)
Notes de version
Extra BandNotes de version
Bug FixesNotes de version
More vwaps
Clause de non-responsabilité
Les informations et publications ne sont pas destinées à être, et ne constituent pas, des conseils ou recommandations financiers, d'investissement, de trading ou autres fournis ou approuvés par TradingView. Pour en savoir plus, consultez les Conditions d'utilisation.
Clause de non-responsabilité
Les informations et publications ne sont pas destinées à être, et ne constituent pas, des conseils ou recommandations financiers, d'investissement, de trading ou autres fournis ou approuvés par TradingView. Pour en savoir plus, consultez les Conditions d'utilisation.