Mis à jour
Prop Algo | PropTraderz V1
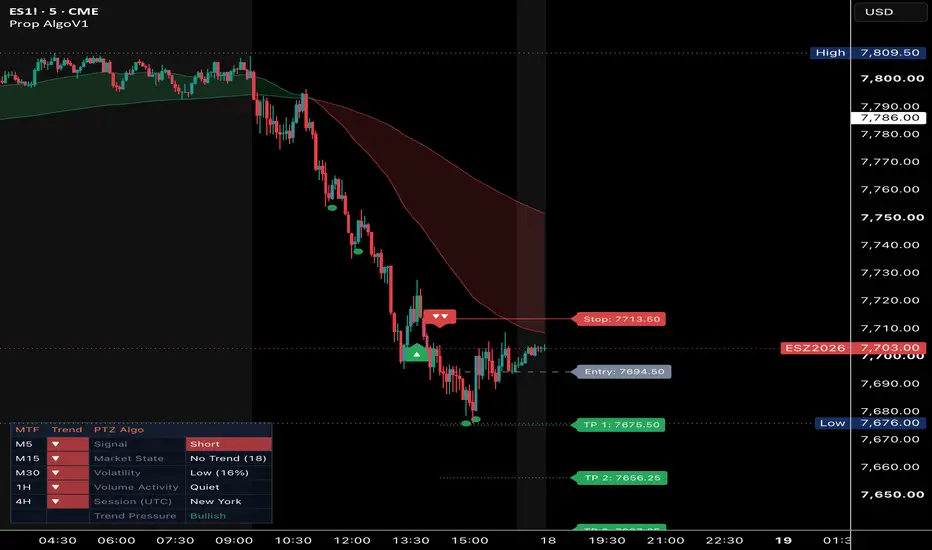
Prop Algo is a trend-following overlay that turns volatility, trend and momentum data into one view: buy/sell signals, a trend filter, trade levels (entry, stop, three targets) and a dashboard with the market context. Each component below has a defined job. They are combined so that a signal only prints when trend, volatility and the chosen filter agree.
Why these components are combined
Each component answers a different question about a trade. On its own, each one has a known weakness that another component covers:
Direction: “Which way is price moving?” The ATR volatility stop. It defines trend direction and the exact flip point, and it adapts to volatility, so the same settings work in calm and in fast markets. Its weakness: in sideways markets it flips back and forth and gives false signals.
Strength: “Is there a real trend?” ADX (Trending mode) and the EMA baselines (Strong and Cloud modes) cover exactly that weakness. ADX measures how strong the trend is, regardless of direction. When it is below 20 the market is usually ranging, and flips there are skipped. The EMA 200 and the EMA 50/200 cloud make sure a signal is not taken against the larger trend.
Location: “Is price stretched?” RSI (Contrarian mode and the Reversal Dots) adds information that a trend engine does not have: whether the move is already extended. That is useful in ranges, where buying after an oversold reading works better than buying a breakout.
Participation: “Is the move backed by volume?” The volume filter keeps only flips that happen with above-average volume. Breakouts on thin volume fail more often.
Momentum quality: “Is the move accelerating or fading?” The slope of the MACD histogram, shown through the candle colors. A trend whose momentum is fading shows up in the candle color before the volatility stop flips. That gives an early warning to tighten stops or take profit.
Risk: “Where am I wrong, and where do I take profit?” ATR also sets the stop distance, and the targets are R multiples of it. The stop therefore scales with current volatility, and every trade has the same risk-to-reward structure, so results are comparable across instruments and timeframes.
Context: “Do the higher timeframes agree?” The dashboard shows the EMA 200 trend on five timeframes, plus ADX, ATR percentile, volume and session. This lets the trader judge signal quality at a glance without opening other charts.
The result is a workflow in which direction, trend strength, location, participation, momentum and risk are checked on one chart, in a fixed order. The script does not just place several indicators side by side. The filters decide whether the engine’s signal is shown, and ATR links the entry to the stop and the targets.
What is original in this script
The script is written from scratch. It uses standard, well-known calculations (ATR, EMA, HMA, RSI, ADX/DMI, MACD) as building blocks. The original part is the way they are put together:
a selectable filter layer that controls whether the volatility-stop signal is shown;
strong signals rated against the long-term EMA;
risk levels in R multiples, scaled with ATR, plus tracking of target and stop hits;
candle coloring that combines trend direction with the slope of momentum;
a single dashboard that summarizes multi-timeframe trend, trend strength, volatility rank, volume activity and session.
How it works
Signal engine: ATR volatility stop
The core is a trailing volatility stop built from the bar midpoint (hl2) ± Sensitivity × ATR(Signal Length). In an uptrend the stop can only move up; in a downtrend it can only move down. A buy signal prints when the close crosses above the stop and the trend flips up, and a sell signal when it crosses below. A lower Sensitivity gives more and earlier signals. A higher one gives fewer, slower signals that ignore more noise.
Signal filters (choose one mode)
All Signals: every trend flip.
Trending: only when ADX(14) is above 20, which filters out flat, choppy conditions.
Contrarian: buys only after RSI(14) has recently been below 35, sells only after it has been above 65, so you trade reversals out of stretched moves.
High Volume: only when volume is at least 20% above its 20-bar average.
Strong: buys only above the Strong EMA (default 200), sells only below it.
Cloud modes (Swing / Smooth / Scalping): the signal must agree with a trend baseline (EMA 34, the EMA 50/200 cloud, or HMA 21).
A signal is marked as “strong” (double arrow) when it also agrees with the Strong EMA.
Risk management
At each signal the script records the entry (signal close) and places the stop at Stop Loss × ATR(14) beyond the entry. TP1, TP2 and TP3 are set as multiples of that risk (1R, 2R and 3R by default). The levels are drawn for the active trade. An “TP” marker appears on the bar where a target is reached, and tracking stops when the stop is hit. An optional line shows the trailing volatility stop.
Trading assistants
Trend Cloud: EMA 50/200 cloud, green when the fast EMA is above the slow one, red when below.
Reversal Dots: RSI crossing back out of the 30/70 zones, a hint that a move may be running out.
Momentum Candles: candles are colored from the trend direction plus the slope of the MACD histogram. Green or red means trend and momentum agree. Neutral means momentum is fading against the trend.
Market Structure: optional HH / HL / LH / LL labels from confirmed pivots.
Scalp Ribbon: optional EMA 8/13/21.
Dashboard
MTF trend: price above or below EMA 200 on the 5m, 15m, 30m, 1h and 4h charts.
Market State: ADX-based, either Trending, Ranging or No Trend.
Volatility: ATR percentile over the last 100 bars.
Volume Activity: volume compared with its 21-bar average.
Current trading session (UTC).
Trend pressure: EMA 9 slope.
How to use it
Use the signals in the direction of the higher timeframes on the dashboard. A buy with the 1h and 4h both green is a higher-quality setup than one against them.
Use “Trending” mode in normal conditions. Switch to “Contrarian” in ranges, or to a Cloud mode to stay with the main trend.
Treat the TP levels as planning references, not as guaranteed targets. Adjust Stop Loss (ATR x) and the R multiples to your instrument and timeframe.
Signals are confirmed when the bar closes. On the live bar a signal can still appear and disappear until the close.
Alerts
Buy, Strong Buy, Sell, Strong Sell, TP1/TP2/TP3 hit, Stop Loss hit, and Bullish/Bearish Cloud Cross.
Disclaimer
This indicator is an analysis tool, not financial advice. Past signals do not guarantee future results. Always use your own risk management.
Why these components are combined
Each component answers a different question about a trade. On its own, each one has a known weakness that another component covers:
Direction: “Which way is price moving?” The ATR volatility stop. It defines trend direction and the exact flip point, and it adapts to volatility, so the same settings work in calm and in fast markets. Its weakness: in sideways markets it flips back and forth and gives false signals.
Strength: “Is there a real trend?” ADX (Trending mode) and the EMA baselines (Strong and Cloud modes) cover exactly that weakness. ADX measures how strong the trend is, regardless of direction. When it is below 20 the market is usually ranging, and flips there are skipped. The EMA 200 and the EMA 50/200 cloud make sure a signal is not taken against the larger trend.
Location: “Is price stretched?” RSI (Contrarian mode and the Reversal Dots) adds information that a trend engine does not have: whether the move is already extended. That is useful in ranges, where buying after an oversold reading works better than buying a breakout.
Participation: “Is the move backed by volume?” The volume filter keeps only flips that happen with above-average volume. Breakouts on thin volume fail more often.
Momentum quality: “Is the move accelerating or fading?” The slope of the MACD histogram, shown through the candle colors. A trend whose momentum is fading shows up in the candle color before the volatility stop flips. That gives an early warning to tighten stops or take profit.
Risk: “Where am I wrong, and where do I take profit?” ATR also sets the stop distance, and the targets are R multiples of it. The stop therefore scales with current volatility, and every trade has the same risk-to-reward structure, so results are comparable across instruments and timeframes.
Context: “Do the higher timeframes agree?” The dashboard shows the EMA 200 trend on five timeframes, plus ADX, ATR percentile, volume and session. This lets the trader judge signal quality at a glance without opening other charts.
The result is a workflow in which direction, trend strength, location, participation, momentum and risk are checked on one chart, in a fixed order. The script does not just place several indicators side by side. The filters decide whether the engine’s signal is shown, and ATR links the entry to the stop and the targets.
What is original in this script
The script is written from scratch. It uses standard, well-known calculations (ATR, EMA, HMA, RSI, ADX/DMI, MACD) as building blocks. The original part is the way they are put together:
a selectable filter layer that controls whether the volatility-stop signal is shown;
strong signals rated against the long-term EMA;
risk levels in R multiples, scaled with ATR, plus tracking of target and stop hits;
candle coloring that combines trend direction with the slope of momentum;
a single dashboard that summarizes multi-timeframe trend, trend strength, volatility rank, volume activity and session.
How it works
Signal engine: ATR volatility stop
The core is a trailing volatility stop built from the bar midpoint (hl2) ± Sensitivity × ATR(Signal Length). In an uptrend the stop can only move up; in a downtrend it can only move down. A buy signal prints when the close crosses above the stop and the trend flips up, and a sell signal when it crosses below. A lower Sensitivity gives more and earlier signals. A higher one gives fewer, slower signals that ignore more noise.
Signal filters (choose one mode)
All Signals: every trend flip.
Trending: only when ADX(14) is above 20, which filters out flat, choppy conditions.
Contrarian: buys only after RSI(14) has recently been below 35, sells only after it has been above 65, so you trade reversals out of stretched moves.
High Volume: only when volume is at least 20% above its 20-bar average.
Strong: buys only above the Strong EMA (default 200), sells only below it.
Cloud modes (Swing / Smooth / Scalping): the signal must agree with a trend baseline (EMA 34, the EMA 50/200 cloud, or HMA 21).
A signal is marked as “strong” (double arrow) when it also agrees with the Strong EMA.
Risk management
At each signal the script records the entry (signal close) and places the stop at Stop Loss × ATR(14) beyond the entry. TP1, TP2 and TP3 are set as multiples of that risk (1R, 2R and 3R by default). The levels are drawn for the active trade. An “TP” marker appears on the bar where a target is reached, and tracking stops when the stop is hit. An optional line shows the trailing volatility stop.
Trading assistants
Trend Cloud: EMA 50/200 cloud, green when the fast EMA is above the slow one, red when below.
Reversal Dots: RSI crossing back out of the 30/70 zones, a hint that a move may be running out.
Momentum Candles: candles are colored from the trend direction plus the slope of the MACD histogram. Green or red means trend and momentum agree. Neutral means momentum is fading against the trend.
Market Structure: optional HH / HL / LH / LL labels from confirmed pivots.
Scalp Ribbon: optional EMA 8/13/21.
Dashboard
MTF trend: price above or below EMA 200 on the 5m, 15m, 30m, 1h and 4h charts.
Market State: ADX-based, either Trending, Ranging or No Trend.
Volatility: ATR percentile over the last 100 bars.
Volume Activity: volume compared with its 21-bar average.
Current trading session (UTC).
Trend pressure: EMA 9 slope.
How to use it
Use the signals in the direction of the higher timeframes on the dashboard. A buy with the 1h and 4h both green is a higher-quality setup than one against them.
Use “Trending” mode in normal conditions. Switch to “Contrarian” in ranges, or to a Cloud mode to stay with the main trend.
Treat the TP levels as planning references, not as guaranteed targets. Adjust Stop Loss (ATR x) and the R multiples to your instrument and timeframe.
Signals are confirmed when the bar closes. On the live bar a signal can still appear and disappear until the close.
Alerts
Buy, Strong Buy, Sell, Strong Sell, TP1/TP2/TP3 hit, Stop Loss hit, and Bullish/Bearish Cloud Cross.
Disclaimer
This indicator is an analysis tool, not financial advice. Past signals do not guarantee future results. Always use your own risk management.
Notes de version
Updated chart snapshot – clean chart showing only the indicator.
PropTraderz
Clause de non-responsabilité
Les informations et publications ne sont pas destinées à être, et ne constituent pas, des conseils ou recommandations financiers, d'investissement, de trading ou autres fournis ou approuvés par TradingView. Pour en savoir plus, consultez les Conditions d'utilisation.
PropTraderz
Clause de non-responsabilité
Les informations et publications ne sont pas destinées à être, et ne constituent pas, des conseils ou recommandations financiers, d'investissement, de trading ou autres fournis ou approuvés par TradingView. Pour en savoir plus, consultez les Conditions d'utilisation.