Overextension Map Rejection vs Acceptance
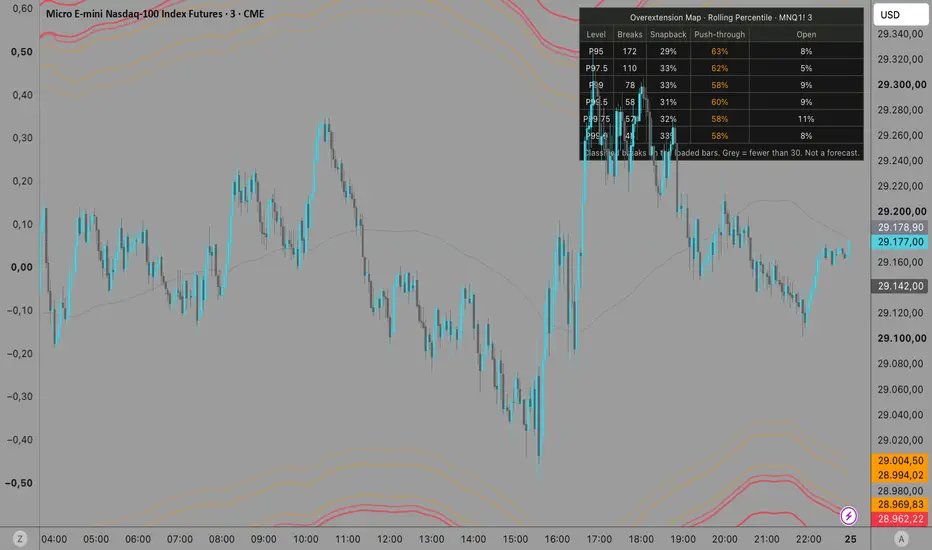
Most band indicators show WHERE price is stretched. Overextension Map also answers the more useful question: is the stretch being REJECTED or ACCEPTED?
HOW IT WORKS
1) Three ways to measure overextension, each with six levels
• Rolling STDV – moving average ± standard deviations (default 2.0 / 2.25 / 2.5 / 4.0 / 4.25 / 4.5)
• Session STDV – mean and deviation since the start of the trading day (intraday charts)
• Rolling Percentile – the distance from the moving average that was exceeded only 5% / 2.5% / 1% / 0.5% / 0.25% / 0.1% of the time. No normal-distribution assumption, which matters in markets with fat tails.
2) Frozen line
When a bar closes beyond a band after closing inside it, that band value is frozen and drawn as a dashed line.
3) Classification on bar closes only
• Snapback (teal): N consecutive closes back inside the frozen line – the stretch was rejected.
• Push-through (orange): N consecutive closes beyond the frozen line – the stretch was accepted.
• Open (grey, dotted): neither within the decision window.
4) Table
For every level: how many breaks occurred on the loaded history of this symbol and timeframe, and how they were classified. The dominant behaviour is highlighted.
WHY IT IS USEFUL
The same band touch means very different things in different markets and timeframes. On some charts most extreme breaks snap back; on others most of them are accepted and the move continues. The table shows which behaviour dominates on the chart you are looking at, so you do not treat every band touch as a fade.
SETTINGS
• Method, source and lookback lengths
• Six levels (STDV multiples or percentiles)
• Confirming closes (default 2) and decision window (default 6 bars)
• Which levels show frozen lines and markers, table position, colours
ALERTS
Band break · Snapback · Push-through
NOTES
• All calculations use confirmed bars – markers and statistics do not repaint.
• Statistics are based on the bars loaded on your chart. Small samples (fewer than 30 breaks) are shown in grey.
• Session STDV is designed for intraday charts. On daily charts use Rolling STDV or Rolling Percentile.
• This is an educational and analytical tool. It does not generate trade signals, and the statistics are not a forecast. Trading involves risk.
HOW IT WORKS
1) Three ways to measure overextension, each with six levels
• Rolling STDV – moving average ± standard deviations (default 2.0 / 2.25 / 2.5 / 4.0 / 4.25 / 4.5)
• Session STDV – mean and deviation since the start of the trading day (intraday charts)
• Rolling Percentile – the distance from the moving average that was exceeded only 5% / 2.5% / 1% / 0.5% / 0.25% / 0.1% of the time. No normal-distribution assumption, which matters in markets with fat tails.
2) Frozen line
When a bar closes beyond a band after closing inside it, that band value is frozen and drawn as a dashed line.
3) Classification on bar closes only
• Snapback (teal): N consecutive closes back inside the frozen line – the stretch was rejected.
• Push-through (orange): N consecutive closes beyond the frozen line – the stretch was accepted.
• Open (grey, dotted): neither within the decision window.
4) Table
For every level: how many breaks occurred on the loaded history of this symbol and timeframe, and how they were classified. The dominant behaviour is highlighted.
WHY IT IS USEFUL
The same band touch means very different things in different markets and timeframes. On some charts most extreme breaks snap back; on others most of them are accepted and the move continues. The table shows which behaviour dominates on the chart you are looking at, so you do not treat every band touch as a fade.
SETTINGS
• Method, source and lookback lengths
• Six levels (STDV multiples or percentiles)
• Confirming closes (default 2) and decision window (default 6 bars)
• Which levels show frozen lines and markers, table position, colours
ALERTS
Band break · Snapback · Push-through
NOTES
• All calculations use confirmed bars – markers and statistics do not repaint.
• Statistics are based on the bars loaded on your chart. Small samples (fewer than 30 breaks) are shown in grey.
• Session STDV is designed for intraday charts. On daily charts use Rolling STDV or Rolling Percentile.
• This is an educational and analytical tool. It does not generate trade signals, and the statistics are not a forecast. Trading involves risk.

Clause de non-responsabilité
Les informations et publications ne sont pas destinées à être, et ne constituent pas, des conseils ou recommandations financiers, d'investissement, de trading ou autres fournis ou approuvés par TradingView. Pour en savoir plus, consultez les Conditions d'utilisation.
Clause de non-responsabilité
Les informations et publications ne sont pas destinées à être, et ne constituent pas, des conseils ou recommandations financiers, d'investissement, de trading ou autres fournis ou approuvés par TradingView. Pour en savoir plus, consultez les Conditions d'utilisation.