Mis à jour
Fisher Transform of Williams %R - Divergence
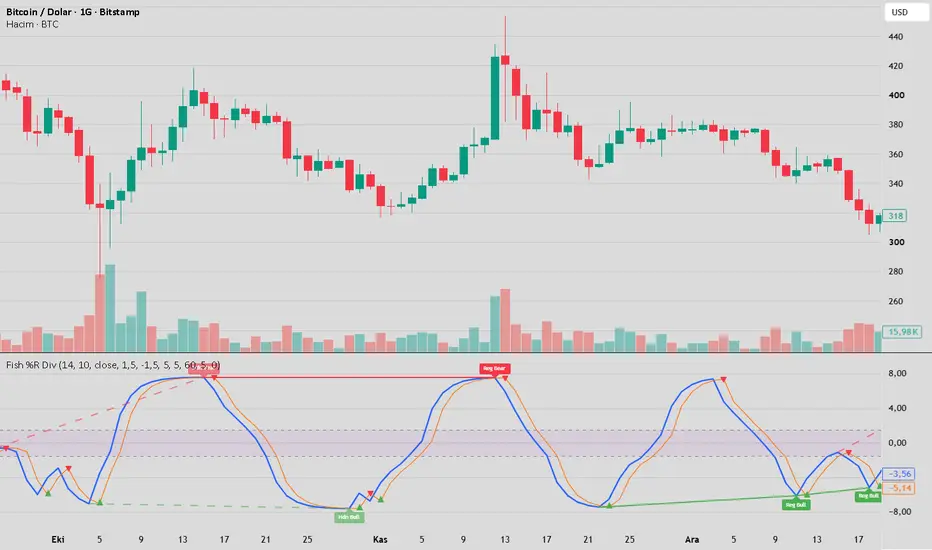
Fisher Transform of Williams %R — Divergence
Overview
This indicator applies John Ehlers' Fisher Transform to Larry Williams' %R oscillator, then layers a pivot-based regular/hidden divergence engine and a Fisher/Trigger crossover signal on top of it. The goal is to combine the sharp, well-defined turning points that the Fisher Transform produces with the momentum context of Williams %R, so that reversals show up as cleaner, more clearly separated peaks and troughs than the raw oscillator gives you — and then to automatically flag price/oscillator divergences at those points.
Credits
The Fisher Transform is a statistical technique introduced to trading by John F. Ehlers (see his paper "Using The Fisher Transform," Stocks & Commodities magazine). It converts an oscillator's probability distribution into a roughly Gaussian (bell-curve) distribution, which sharpens turning points and reduces the ambiguity that flat, range-bound oscillator readings normally produce.
Williams %R is a momentum oscillator developed by Larry Williams, measuring the current close relative to the high-low range over a lookback period.
This script normalizes Williams %R to a 0–1 range and runs that normalized value through Ehlers' Fisher Transform formula, rather than applying the transform to raw price or to a different oscillator. The divergence engine, cross-signal logic, zone filtering, and signal-spacing controls are original additions built for this script.
How it works
Williams %R is calculated over Williams %R Length bars: 100 × (source − highest high) / (highest high − lowest low).
That value is normalized to a 0–1 range using the highest/lowest %R over Fisher Transform Length bars, then rescaled to −1…+1.
The normalized value is smoothed (0.66 × normalized + 0.67 × previous) and clamped to ±0.999 to keep the Fisher formula well-defined.
The Fisher Transform is applied: 0.5 × ln((1+x)/(1−x)) + 0.5 × previous Fisher value. This is the plotted "Fisher %R" line.
A one-bar-delayed copy of the Fisher line acts as the Trigger line, used for crossover signals.
Divergence detection: the script finds confirmed pivot highs/lows on the Fisher line (using Pivot Left/Right Lookback), then looks back within a Min/Max Lookback Range window for a prior pivot of the same type to compare against price:
Regular Bullish: price makes a lower low while Fisher makes a higher low (potential reversal up).
Hidden Bullish: price makes a higher low while Fisher makes a lower low (trend continuation up).
Regular Bearish / Hidden Bearish: mirror logic on pivot highs.
Cross signals: independent triangle markers plot whenever the Fisher line crosses above/below its own Trigger line — a faster, divergence-independent momentum confirmation.
Parameters
Williams %R Length — lookback for the base %R calculation; shorter = more responsive, noisier.
Fisher Transform Length — lookback used to normalize %R before the transform; controls how "stretched" the Fisher output is.
Source — price input for %R (default close).
Overbought / Oversold Level — Fisher levels used for the background zone and, optionally, to filter divergence signals.
Pivot Left/Right Lookback — bars required on each side to confirm a swing high/low on the Fisher line; larger values = fewer but more reliable pivots.
Max/Min Lookback Range — bar-distance window searched for a comparable prior pivot when checking divergence.
Min Bars Between Same-Type Signals — cooldown to suppress rapid repeat signals of the same type.
Show Regular/Hidden Divergence — toggle each divergence class independently.
Require OB/OS Zone for Divergence — when on, only fires divergence signals when the relevant pivot is inside the overbought/oversold zone, cutting down low-quality mid-range signals.
Show Fisher/Trigger Cross Signals — toggle the crossover triangles.
Color inputs — purely visual, no effect on signal logic.
How to use it
Watch the Fisher line relative to the Trigger line and the OB/OS zone the way you would any oscillator, but expect sharper, more decisive turns than plain Williams %R.
Solid divergence lines/labels ("Reg Bull," "Reg Bear") mark classic reversal-warning divergences; dashed ones ("Hdn Bull," "Hdn Bear") mark continuation divergences, useful for adding to an existing trend rather than fading it.
Triangle cross signals can be used as a faster, standalone trigger, or as confirmation once a divergence has printed.
All four divergence types and both cross directions have built-in alertcondition() calls, so alerts can be set directly from the "Create Alert" dialog without any manual configuration.
What it solves / how it differs from other tools
Plain Williams %R divergence detection is noisy because %R saturates near ±100 across a wide range of price action, blurring pivots. Running it through the Fisher Transform first compresses that noise into sharper, more Gaussian-shaped peaks, giving divergence detection a cleaner signal to work from than a raw-oscillator approach.
Unlike many public Fisher Transform scripts (which typically transform price directly, or transform RSI/Stochastic), this one is specifically built on Williams %R, giving a different — often earlier — read on exhaustion at range extremes.
The zone filter and same-type signal cooldown are both configurable, letting users trade off signal frequency against signal quality, which many divergence scripts don't expose.
Notes / Disclaimer
This indicator is a technical analysis tool and does not constitute financial advice. It repaints only in the sense that divergence lines/labels are drawn after pivot confirmation (lbR bars after the pivot bar), which is standard for any pivot-based divergence tool and is by design — the underlying Fisher/Trigger plot values themselves do not repaint. As with any oscillator, past signals do not guarantee future performance; test and combine with your own risk management before live use.
Overview
This indicator applies John Ehlers' Fisher Transform to Larry Williams' %R oscillator, then layers a pivot-based regular/hidden divergence engine and a Fisher/Trigger crossover signal on top of it. The goal is to combine the sharp, well-defined turning points that the Fisher Transform produces with the momentum context of Williams %R, so that reversals show up as cleaner, more clearly separated peaks and troughs than the raw oscillator gives you — and then to automatically flag price/oscillator divergences at those points.
Credits
The Fisher Transform is a statistical technique introduced to trading by John F. Ehlers (see his paper "Using The Fisher Transform," Stocks & Commodities magazine). It converts an oscillator's probability distribution into a roughly Gaussian (bell-curve) distribution, which sharpens turning points and reduces the ambiguity that flat, range-bound oscillator readings normally produce.
Williams %R is a momentum oscillator developed by Larry Williams, measuring the current close relative to the high-low range over a lookback period.
This script normalizes Williams %R to a 0–1 range and runs that normalized value through Ehlers' Fisher Transform formula, rather than applying the transform to raw price or to a different oscillator. The divergence engine, cross-signal logic, zone filtering, and signal-spacing controls are original additions built for this script.
How it works
Williams %R is calculated over Williams %R Length bars: 100 × (source − highest high) / (highest high − lowest low).
That value is normalized to a 0–1 range using the highest/lowest %R over Fisher Transform Length bars, then rescaled to −1…+1.
The normalized value is smoothed (0.66 × normalized + 0.67 × previous) and clamped to ±0.999 to keep the Fisher formula well-defined.
The Fisher Transform is applied: 0.5 × ln((1+x)/(1−x)) + 0.5 × previous Fisher value. This is the plotted "Fisher %R" line.
A one-bar-delayed copy of the Fisher line acts as the Trigger line, used for crossover signals.
Divergence detection: the script finds confirmed pivot highs/lows on the Fisher line (using Pivot Left/Right Lookback), then looks back within a Min/Max Lookback Range window for a prior pivot of the same type to compare against price:
Regular Bullish: price makes a lower low while Fisher makes a higher low (potential reversal up).
Hidden Bullish: price makes a higher low while Fisher makes a lower low (trend continuation up).
Regular Bearish / Hidden Bearish: mirror logic on pivot highs.
Cross signals: independent triangle markers plot whenever the Fisher line crosses above/below its own Trigger line — a faster, divergence-independent momentum confirmation.
Parameters
Williams %R Length — lookback for the base %R calculation; shorter = more responsive, noisier.
Fisher Transform Length — lookback used to normalize %R before the transform; controls how "stretched" the Fisher output is.
Source — price input for %R (default close).
Overbought / Oversold Level — Fisher levels used for the background zone and, optionally, to filter divergence signals.
Pivot Left/Right Lookback — bars required on each side to confirm a swing high/low on the Fisher line; larger values = fewer but more reliable pivots.
Max/Min Lookback Range — bar-distance window searched for a comparable prior pivot when checking divergence.
Min Bars Between Same-Type Signals — cooldown to suppress rapid repeat signals of the same type.
Show Regular/Hidden Divergence — toggle each divergence class independently.
Require OB/OS Zone for Divergence — when on, only fires divergence signals when the relevant pivot is inside the overbought/oversold zone, cutting down low-quality mid-range signals.
Show Fisher/Trigger Cross Signals — toggle the crossover triangles.
Color inputs — purely visual, no effect on signal logic.
How to use it
Watch the Fisher line relative to the Trigger line and the OB/OS zone the way you would any oscillator, but expect sharper, more decisive turns than plain Williams %R.
Solid divergence lines/labels ("Reg Bull," "Reg Bear") mark classic reversal-warning divergences; dashed ones ("Hdn Bull," "Hdn Bear") mark continuation divergences, useful for adding to an existing trend rather than fading it.
Triangle cross signals can be used as a faster, standalone trigger, or as confirmation once a divergence has printed.
All four divergence types and both cross directions have built-in alertcondition() calls, so alerts can be set directly from the "Create Alert" dialog without any manual configuration.
What it solves / how it differs from other tools
Plain Williams %R divergence detection is noisy because %R saturates near ±100 across a wide range of price action, blurring pivots. Running it through the Fisher Transform first compresses that noise into sharper, more Gaussian-shaped peaks, giving divergence detection a cleaner signal to work from than a raw-oscillator approach.
Unlike many public Fisher Transform scripts (which typically transform price directly, or transform RSI/Stochastic), this one is specifically built on Williams %R, giving a different — often earlier — read on exhaustion at range extremes.
The zone filter and same-type signal cooldown are both configurable, letting users trade off signal frequency against signal quality, which many divergence scripts don't expose.
Notes / Disclaimer
This indicator is a technical analysis tool and does not constitute financial advice. It repaints only in the sense that divergence lines/labels are drawn after pivot confirmation (lbR bars after the pivot bar), which is standard for any pivot-based divergence tool and is by design — the underlying Fisher/Trigger plot values themselves do not repaint. As with any oscillator, past signals do not guarantee future performance; test and combine with your own risk management before live use.
Notes de version
Release Notes - v2.0This update fixes a scaling issue in the Fisher calculation, adds a full set of noise filters for the Fisher/Trigger cross signals, and makes all signals non-repainting.
CORE FIXES
- Fisher scaling corrected: the recursive Fisher input now uses the classic Ehlers scaling (0.33 x normalized value). Previously the line saturated at its clamp limit and could reach roughly +/-7.6, which made the +/-1.5 OB/OS levels meaningless. The oscillator now moves within a realistic range and the default levels behave as intended.
- Neutral fallbacks: when the rolling range is zero or during warm-up, Williams %R now falls back to -50 and the Fisher input to 0 (neutral). Before, these cases could produce false extreme readings.
- Safer warm-up handling using explicit na() checks.
CROSS SIGNAL NOISE FILTERS (new "Cross Signals" settings)
The old trigger (Fisher[1]) fired on nearly every small turn. Signals are now filtered by:
- Trigger EMA Length (default 3). Set to 1 to restore the classic Fisher[1] trigger.
- Require Recent OB/OS Extreme: Buy needs a recent oversold reading, Sell needs a recent overbought reading (Extreme Lookback Bars, default 8).
- Buy Below / Sell Above Zero Line.
- Alternate Signals Only (Buy-Sell-Buy): no repeated signals in the same direction.
- Min Bars Between Cross Signals (default 3).
Every filter can be switched off individually, so you can loosen or tighten the signal density to your style.
DIVERGENCE ENGINE
- New Min Fisher Difference setting (default 0.10) to filter out negligible divergences between pivots.
- Spacing between same-type divergences is now measured between pivot bars. Note that values at or below Min Lookback Range have no practical effect.
- Regular and hidden divergence conditions are evaluated in a single if / else-if chain.
NON-REPAINTING
- Cross signals and divergences are only generated on bar close (barstate.isconfirmed), and alerts fire once, on confirmation.
- As with any pivot-based divergence tool, divergence labels appear "Pivot Right Lookback" bars after the actual pivot. This is the confirmation delay, not repainting.
ALERTS
- Added alerts for the filtered Buy and Sell crosses, alongside the four divergence alerts (regular/hidden, bullish/bearish).
STYLE & INPUTS
- New "Style & Colors" group with separate colors for divergences, the Fisher line and the Trigger line.
- Source input now uses input.source().
- Descriptive script title, short title "Fish%R Div".
USAGE NOTES
- With "Alternate Signals Only" and "Require Recent OB/OS Extreme" both on, a Buy that is not followed by an overbought excursion will not produce a Sell, and further Buys are blocked until a Sell appears. This is the price of a cleaner signal set. Turn "Alternate Signals Only" off if you want a looser signal flow.
- If signals are too rare: disable "Require Recent OB/OS Extreme" or increase "Extreme Lookback Bars". If they are still too frequent: increase "Min Bars Between Cross Signals" or set "Trigger EMA Length" to 5.
This script is for educational and analytical purposes only and is not financial advice.

Clause de non-responsabilité
Les informations et publications ne sont pas destinées à être, et ne constituent pas, des conseils ou recommandations financiers, d'investissement, de trading ou autres fournis ou approuvés par TradingView. Pour en savoir plus, consultez les Conditions d'utilisation.
Clause de non-responsabilité
Les informations et publications ne sont pas destinées à être, et ne constituent pas, des conseils ou recommandations financiers, d'investissement, de trading ou autres fournis ou approuvés par TradingView. Pour en savoir plus, consultez les Conditions d'utilisation.