Trend Stripes Alignment [josseliani]
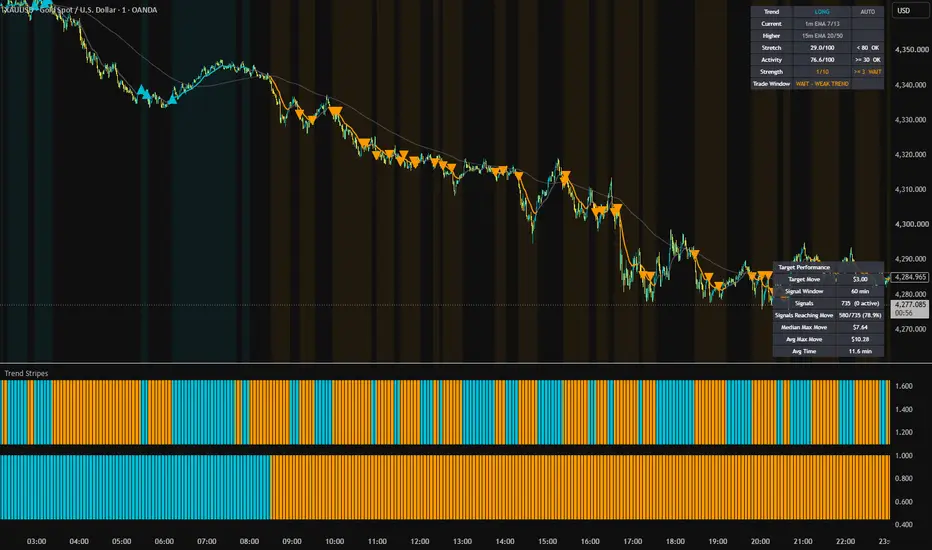
Trend is your friend.
Trading with the trend gives you a starting point. But which trend? The direction can change with the timeframe. Which chart should you trade, which timeframe should provide context, and when is a trend still worth following?
Trend Stripes Alignment was built to make those questions easier to answer.
How it works
The two stripes
Two stripes in the indicator pane show the direction of the working timeframe and a higher timeframe. When they agree, there is a potential window to look for trades in that direction. When they disagree, the indicator waits.
Each stripe holds its last confirmed direction until the opposite direction meets that stripe's confirmation rules. A brief narrowing or flattening of the moving averages does not immediately reverse the stripe. This reduces rapid color changes during sideways movement. The stripes therefore show the last confirmed direction, rather than every temporary change in moving-average position.
Trade filters
Agreement alone is not enough. Three filters check current volatility, price extension from the Reference MA, and trend separation.
The volatility filter helps avoid a quiet market. The price-extension filter limits signals when price has already moved unusually far from the Reference MA, so a buy or sell may come near the extreme of that move.
The strength filter normally measures the separation of the moving averages used by the higher-timeframe stripe, relative to ATR on that timeframe. Auto 15m is the exception: it measures the separation of 15m EMA 20/50, while the higher stripe gets its direction from 4H price relative to EMA 200.
The Context Table shows which conditions pass and which block signals.
→ The triangles mark moments when the indicator's conditions allowed a search for trend-following trades. They are not buy or sell instructions or ready-made entry prices. A trader still needs a personal entry setup, risk plan, and exit rules.
A first triangle can appear after alignment when the candle qualifies relative to the Entry EMA and the filters pass. A later triangle can appear on a fresh Entry EMA touch after price has moved far enough away. Both types contribute to Target Performance. Signals are confirmed at candle close.
How I use it
I start with the two stripes: do the working and higher timeframes point in the same direction? Then I check the Context Table. If volatility is too low, price is already extended, or trend separation is too weak, I wait. If conditions allow it, I look for my own setup on the chart.
I use Target Performance to compare instruments and assess what movement may be reasonable to investigate. If an instrument usually traveled less after these signals than I expect to capture, that is a reason to reassess my expectations instead of holding out for a rare large move.
The statistics inform an exit plan; they do not set a take-profit.
Target Performance
The table analyzes the indicator's triangles, including retests. Each observation starts at the signal candle's close.
In the settings, Target Move specifies the favorable price move to check, and Signal Window sets the number of minutes allowed to reach it. A target is reached when price touches that level after the signal.
→ Both values appear as separate rows in the same Target Performance table.
An observation ends when the selected window expires or the higher-timeframe stripe changes its confirmed direction, whichever happens first. A change of the working-timeframe stripe alone does not end an existing observation.
The table counts how many completed signals reached the specified move and how many did not. It also records each signal's maximum favorable move during its observation window, which is used for the median and average below.
Currency-pair moves are shown in pips. On XAUUSD, Target Move 3 means a $3 change in the gold quote, not $3 profit on a position. Index moves are shown in index points. Other symbols use their chart-price units when no unambiguous unit label is available.
Signals shows the total number of recorded triangles and how many are still active.
Signals Reaching Move shows hits divided by completed signals that had price data in their evaluation window. Active signals and signals without usable price data are not included in that percentage.
Median Max Move is the middle value of the maximum favorable moves across completed, analyzed signals.
Avg Max Move is the mean of those same moves; unusual impulses can pull it higher. Together they help assess an instrument's usual movement and avoid waiting for a move it has rarely offered under the measured conditions. Neither number predicts the next signal.
Avg Time is the average time to the selected move only among signals that reached it. Touch time is estimated at the close of the candle used to check the move.
→ These are signal statistics, not a backtest of actual trades. The table does not include a stop loss, position size, transaction costs, slippage, or a personal exit method. The available chart and lower-timeframe candle history affect sample size, especially on higher chart timeframes. Check the number of completed, analyzed signals before drawing conclusions.
Settings
Auto presets
Mode: Auto selects the current and higher trend combinations for supported chart timeframes:
→ 1m EMA 7/13 with 15m EMA 20/50
→ 5m EMA 50/100 with 1H EMA 135/365
→ 15m EMA 20/50 with 4H Price/EMA 200
→ 1H EMA 135/365 with 1D EMA 5/22
→ 4H Price/EMA 200 with 1D EMA 5/22
The Custom MA fields are ignored in Auto. Choose Custom to set your own stripe timeframes, MA methods, sources, and lengths.
Signals and filters
Signal Sensitivity sets how much of a candle's body must be beyond the Entry EMA for a triangle:
→ Early: 25%
→ Balanced: 50%
→ Confirmed: 100%
Entry EMA Length sets that EMA. Retest Cooldown Distance In ATR controls how far price must move away before another qualifying EMA touch can create a retest triangle. Signal Size changes the triangle display.
Reference MA is used for the price-extension calculation and is shown on the chart by default. Its length, method, and source are adjustable; it does not set stripe direction.
Max Price Stretch compares the price-to-reference-MA distance, scaled by ATR, with its recent history. Its default ceiling of 80 blocks signals at roughly the 20% most extended readings in the trade direction. This does not mean a 20% price move or that exactly 20% of signals are removed; the filter cannot identify a high or low in advance.
Min Market Activity compares current ATR with its recent history. Here, “activity” means volatility, not volume. The default minimum is 30.
Min Trend Strength measures separation on a 1–10 scale. Normally it compares the higher-timeframe MA pair with ATR on that timeframe. In Auto 15m it instead compares 15m EMA 20/50 with 15m ATR. Being close to 4H EMA 200 therefore does not, by itself, block a signal through this filter. The strength score is not a probability of success.
Market History Lookback sets the history length for the extension and volatility comparisons.
Table display
Show Target Performance and Show Context Table control the two tables. Table Size applies to both; Small is the default so the tables cover less of the screen on mobile devices.
Target Move and Signal Window are configured separately in the Target Performance section, and their current values appear as rows in that table. Each table's screen position can also be set separately.
Alerts
Bullish Trend Stripes Alignment and Bearish Trend Stripes Alignment fire when the two stripes first agree at a candle close. These alerts report trend agreement even if a trade filter still blocks the Trade Window.
Allowed Buy Signal and Allowed Sell Signal correspond to confirmed triangles after the trade filters pass. Alert messages include the symbol and chart timeframe.
None of these alerts represents an executed trade.
What makes it different
The indicator connects two-timeframe trend alignment, conditions for considering a trade, and historical movement after its own permission triangles.
The Context Table explains why signals are currently allowed or blocked. Target Performance shows how often a chosen movement followed a signal and how far price typically traveled, without presenting those observations as trades or promised results.
→ What is the trend?
→ Is this instrument worth watching?
→ When do conditions allow trading with the trend?
→ How much movement is reasonable to expect without holding out for a rare move?
Trading with the trend gives you a starting point. But which trend? The direction can change with the timeframe. Which chart should you trade, which timeframe should provide context, and when is a trend still worth following?
Trend Stripes Alignment was built to make those questions easier to answer.
How it works
The two stripes
Two stripes in the indicator pane show the direction of the working timeframe and a higher timeframe. When they agree, there is a potential window to look for trades in that direction. When they disagree, the indicator waits.
Each stripe holds its last confirmed direction until the opposite direction meets that stripe's confirmation rules. A brief narrowing or flattening of the moving averages does not immediately reverse the stripe. This reduces rapid color changes during sideways movement. The stripes therefore show the last confirmed direction, rather than every temporary change in moving-average position.
Trade filters
Agreement alone is not enough. Three filters check current volatility, price extension from the Reference MA, and trend separation.
The volatility filter helps avoid a quiet market. The price-extension filter limits signals when price has already moved unusually far from the Reference MA, so a buy or sell may come near the extreme of that move.
The strength filter normally measures the separation of the moving averages used by the higher-timeframe stripe, relative to ATR on that timeframe. Auto 15m is the exception: it measures the separation of 15m EMA 20/50, while the higher stripe gets its direction from 4H price relative to EMA 200.
The Context Table shows which conditions pass and which block signals.
→ The triangles mark moments when the indicator's conditions allowed a search for trend-following trades. They are not buy or sell instructions or ready-made entry prices. A trader still needs a personal entry setup, risk plan, and exit rules.
A first triangle can appear after alignment when the candle qualifies relative to the Entry EMA and the filters pass. A later triangle can appear on a fresh Entry EMA touch after price has moved far enough away. Both types contribute to Target Performance. Signals are confirmed at candle close.
How I use it
I start with the two stripes: do the working and higher timeframes point in the same direction? Then I check the Context Table. If volatility is too low, price is already extended, or trend separation is too weak, I wait. If conditions allow it, I look for my own setup on the chart.
I use Target Performance to compare instruments and assess what movement may be reasonable to investigate. If an instrument usually traveled less after these signals than I expect to capture, that is a reason to reassess my expectations instead of holding out for a rare large move.
The statistics inform an exit plan; they do not set a take-profit.
Target Performance
The table analyzes the indicator's triangles, including retests. Each observation starts at the signal candle's close.
In the settings, Target Move specifies the favorable price move to check, and Signal Window sets the number of minutes allowed to reach it. A target is reached when price touches that level after the signal.
→ Both values appear as separate rows in the same Target Performance table.
An observation ends when the selected window expires or the higher-timeframe stripe changes its confirmed direction, whichever happens first. A change of the working-timeframe stripe alone does not end an existing observation.
The table counts how many completed signals reached the specified move and how many did not. It also records each signal's maximum favorable move during its observation window, which is used for the median and average below.
Currency-pair moves are shown in pips. On XAUUSD, Target Move 3 means a $3 change in the gold quote, not $3 profit on a position. Index moves are shown in index points. Other symbols use their chart-price units when no unambiguous unit label is available.
Signals shows the total number of recorded triangles and how many are still active.
Signals Reaching Move shows hits divided by completed signals that had price data in their evaluation window. Active signals and signals without usable price data are not included in that percentage.
Median Max Move is the middle value of the maximum favorable moves across completed, analyzed signals.
Avg Max Move is the mean of those same moves; unusual impulses can pull it higher. Together they help assess an instrument's usual movement and avoid waiting for a move it has rarely offered under the measured conditions. Neither number predicts the next signal.
Avg Time is the average time to the selected move only among signals that reached it. Touch time is estimated at the close of the candle used to check the move.
→ These are signal statistics, not a backtest of actual trades. The table does not include a stop loss, position size, transaction costs, slippage, or a personal exit method. The available chart and lower-timeframe candle history affect sample size, especially on higher chart timeframes. Check the number of completed, analyzed signals before drawing conclusions.
Settings
Auto presets
Mode: Auto selects the current and higher trend combinations for supported chart timeframes:
→ 1m EMA 7/13 with 15m EMA 20/50
→ 5m EMA 50/100 with 1H EMA 135/365
→ 15m EMA 20/50 with 4H Price/EMA 200
→ 1H EMA 135/365 with 1D EMA 5/22
→ 4H Price/EMA 200 with 1D EMA 5/22
The Custom MA fields are ignored in Auto. Choose Custom to set your own stripe timeframes, MA methods, sources, and lengths.
Signals and filters
Signal Sensitivity sets how much of a candle's body must be beyond the Entry EMA for a triangle:
→ Early: 25%
→ Balanced: 50%
→ Confirmed: 100%
Entry EMA Length sets that EMA. Retest Cooldown Distance In ATR controls how far price must move away before another qualifying EMA touch can create a retest triangle. Signal Size changes the triangle display.
Reference MA is used for the price-extension calculation and is shown on the chart by default. Its length, method, and source are adjustable; it does not set stripe direction.
Max Price Stretch compares the price-to-reference-MA distance, scaled by ATR, with its recent history. Its default ceiling of 80 blocks signals at roughly the 20% most extended readings in the trade direction. This does not mean a 20% price move or that exactly 20% of signals are removed; the filter cannot identify a high or low in advance.
Min Market Activity compares current ATR with its recent history. Here, “activity” means volatility, not volume. The default minimum is 30.
Min Trend Strength measures separation on a 1–10 scale. Normally it compares the higher-timeframe MA pair with ATR on that timeframe. In Auto 15m it instead compares 15m EMA 20/50 with 15m ATR. Being close to 4H EMA 200 therefore does not, by itself, block a signal through this filter. The strength score is not a probability of success.
Market History Lookback sets the history length for the extension and volatility comparisons.
Table display
Show Target Performance and Show Context Table control the two tables. Table Size applies to both; Small is the default so the tables cover less of the screen on mobile devices.
Target Move and Signal Window are configured separately in the Target Performance section, and their current values appear as rows in that table. Each table's screen position can also be set separately.
Alerts
Bullish Trend Stripes Alignment and Bearish Trend Stripes Alignment fire when the two stripes first agree at a candle close. These alerts report trend agreement even if a trade filter still blocks the Trade Window.
Allowed Buy Signal and Allowed Sell Signal correspond to confirmed triangles after the trade filters pass. Alert messages include the symbol and chart timeframe.
None of these alerts represents an executed trade.
What makes it different
The indicator connects two-timeframe trend alignment, conditions for considering a trade, and historical movement after its own permission triangles.
The Context Table explains why signals are currently allowed or blocked. Target Performance shows how often a chosen movement followed a signal and how far price typically traveled, without presenting those observations as trades or promised results.
→ What is the trend?
→ Is this instrument worth watching?
→ When do conditions allow trading with the trend?
→ How much movement is reasonable to expect without holding out for a rare move?

Indicators, updates & setups:
magicdiagonals.com/
Free Telegram: t.me/magicdiagonals
magicdiagonals.com/
Free Telegram: t.me/magicdiagonals
Clause de non-responsabilité
Les informations et publications ne sont pas destinées à être, et ne constituent pas, des conseils ou recommandations financiers, d'investissement, de trading ou autres fournis ou approuvés par TradingView. Pour en savoir plus, consultez les Conditions d'utilisation.
Indicators, updates & setups:
magicdiagonals.com/
Free Telegram: t.me/magicdiagonals
magicdiagonals.com/
Free Telegram: t.me/magicdiagonals
Clause de non-responsabilité
Les informations et publications ne sont pas destinées à être, et ne constituent pas, des conseils ou recommandations financiers, d'investissement, de trading ou autres fournis ou approuvés par TradingView. Pour en savoir plus, consultez les Conditions d'utilisation.