OPEN-SOURCE SCRIPT
Mis à jour S&P 500 Sector Performance Comparison
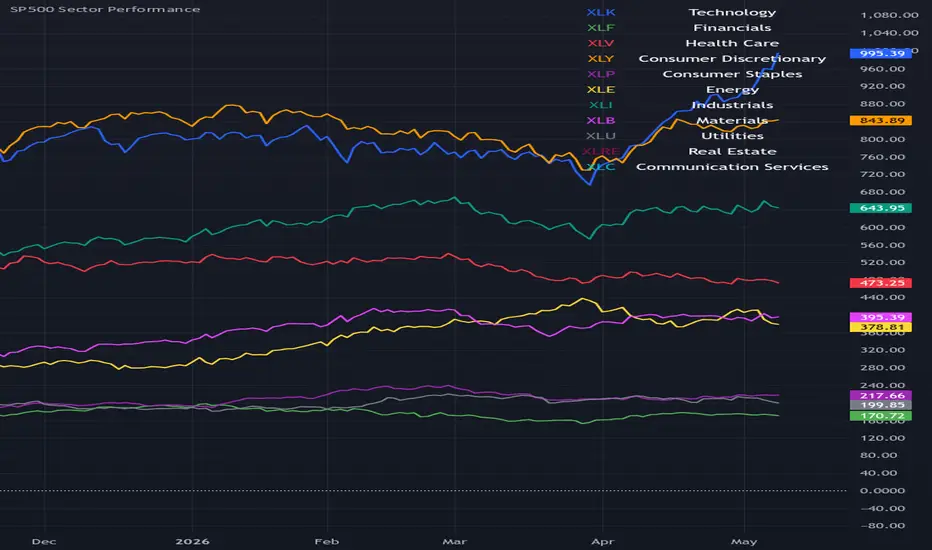
S&P 500 Sector Performance Comparison created by Edgar Simões.
This indicator compares the performance of all 11 S&P 500 Sector SPDR ETFs in a single normalized chart, making it easy to visualize sector rotation, market leadership, and relative strength across different market environments.
Included sectors:
XLK — Technology
XLF — Financials
XLV — Health Care
XLY — Consumer Discretionary
XLP — Consumer Staples
XLE — Energy
XLI — Industrials
XLB — Materials
XLU — Utilities
XLRE — Real Estate
XLC — Communication Services
Features:
Relative performance comparison in percentage terms
Clear color differentiation for each sector
Easy identification of outperforming and underperforming sectors
Useful for macro analysis, sector rotation strategies, and market trend confirmation
Designed for medium and long-term market analysis
This script helps traders and investors quickly identify:
Risk-on vs risk-off environments
Defensive vs growth leadership
Inflation-sensitive sectors
Momentum and sector rotation trends
Author: Edgar
This indicator compares the performance of all 11 S&P 500 Sector SPDR ETFs in a single normalized chart, making it easy to visualize sector rotation, market leadership, and relative strength across different market environments.
Included sectors:
XLK — Technology
XLF — Financials
XLV — Health Care
XLY — Consumer Discretionary
XLP — Consumer Staples
XLE — Energy
XLI — Industrials
XLB — Materials
XLU — Utilities
XLRE — Real Estate
XLC — Communication Services
Features:
Relative performance comparison in percentage terms
Clear color differentiation for each sector
Easy identification of outperforming and underperforming sectors
Useful for macro analysis, sector rotation strategies, and market trend confirmation
Designed for medium and long-term market analysis
This script helps traders and investors quickly identify:
Risk-on vs risk-off environments
Defensive vs growth leadership
Inflation-sensitive sectors
Momentum and sector rotation trends
Author: Edgar
Notes de version
4S&P 500 Sector Performance Comparison created by Edgar Simões.
This indicator compares the performance of all 11 S&P 500 Sector SPDR ETFs in a single normalized chart, making it easy to visualize sector rotation, market leadership, and relative strength across different market environments.
Included sectors:
XLK — Technology
XLF — Financials
XLV — Health Care
XLY — Consumer Discretionary
XLP — Consumer Staples
XLE — Energy
XLI — Industrials
XLB — Materials
XLU — Utilities
XLRE — Real Estate
XLC — Communication Services
Features:
Relative performance comparison in percentage terms
Clear color differentiation for each sector
Easy identification of outperforming and underperforming sectors
Useful for macro analysis, sector rotation strategies, and market trend confirmation
Designed for medium and long-term market analysis
This script helps traders and investors quickly identify:
Risk-on vs risk-off environments
Defensive vs growth leadership
Inflation-sensitive sectors
Momentum and sector rotation trends
Author: Edgar Simões
Notes de version
S&P 500 Sector Performance Comparison created by Edgar Simões.This indicator compares the performance of all 11 S&P 500 Sector SPDR ETFs in a single normalized chart, making it easy to visualize sector rotation, market leadership, and relative strength across different market environments.
Included sectors:
XLK — Technology
XLF — Financials
XLV — Health Care
XLY — Consumer Discretionary
XLP — Consumer Staples
XLE — Energy
XLI — Industrials
XLB — Materials
XLU — Utilities
XLRE — Real Estate
XLC — Communication Services
Features:
Relative performance comparison in percentage terms
Clear color differentiation for each sector
Easy identification of outperforming and underperforming sectors
Useful for macro analysis, sector rotation strategies, and market trend confirmation
Designed for medium and long-term market analysis
This script helps traders and investors quickly identify:
Risk-on vs risk-off environments
Defensive vs growth leadership
Inflation-sensitive sectors
Momentum and sector rotation trends
Author: Edgar Simões
Script open-source
Dans l'esprit TradingView, le créateur de ce script l'a rendu open source afin que les traders puissent examiner et vérifier ses fonctionnalités. Bravo à l'auteur! Bien que vous puissiez l'utiliser gratuitement, n'oubliez pas que la republication du code est soumise à nos Règles.

Clause de non-responsabilité
Les informations et publications ne sont pas destinées à être, et ne constituent pas, des conseils ou recommandations financiers, d'investissement, de trading ou autres fournis ou approuvés par TradingView. Pour en savoir plus, consultez les Conditions d'utilisation.
Script open-source
Dans l'esprit TradingView, le créateur de ce script l'a rendu open source afin que les traders puissent examiner et vérifier ses fonctionnalités. Bravo à l'auteur! Bien que vous puissiez l'utiliser gratuitement, n'oubliez pas que la republication du code est soumise à nos Règles.
Clause de non-responsabilité
Les informations et publications ne sont pas destinées à être, et ne constituent pas, des conseils ou recommandations financiers, d'investissement, de trading ou autres fournis ou approuvés par TradingView. Pour en savoir plus, consultez les Conditions d'utilisation.