OPEN-SOURCE SCRIPT
Mis à jour Institutional Dealer Exhaustion [Smart Edition]
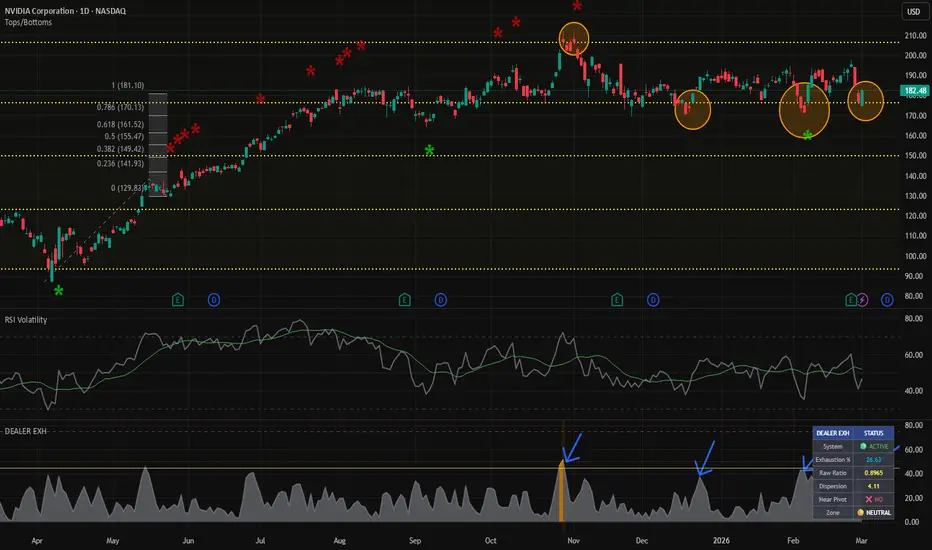
Overview
The Institutional Dealer Exhaustion indicator translates classical overbought/oversold logic into a statistically grounded framework. Rather than measuring price relative to itself (as RSI does), it measures the standardized deviation of price from its Volume Weighted Average Price (VWAP) anchor—the true breakeven reference point for the aggregate of institutional positions.
The result is an oscillator that is naturally regime-aware: a $5 move during a low-volatility consolidation registers as far more "exhausting" than the same move during high-volatility earnings expansion. This prevents the false signals that plague fixed-threshold oscillators in trending markets.
Mathematical Methodology
The core value (E) is derived by mapping the dispersion ratio through a Sigmoid function to ensure the oscillator stays within a 0–100 range without "clipping" at the top.
The Formula:
Exhaustion (E) = 100 * (1 - e^(-0.25 * x))
Raw Ratio (x) = |Price - Anchor| / (ATR * k)
Components:
Anchor: VWAP for intraday; falls back to SMA(20) on Daily+ timeframes.
ATR: Realized volatility used to normalize the distance across different market regimes.
Sigmoid Function: Maps the raw ratio to a 0–100 scale. This ensures that even small price deviations produce visible, proportional waves while extreme moves asymptotically approach 100%.
Zone InterpretationRange
0 – 25% Equilibrium Price is hugging the anchor. Dealers can manage delta cheaply. Trend continuation is favored.
25 – 50% NeutralDirectional bias is developing. Hedging costs are rising but manageable.
50 – 75% SaturationDealer hedging becomes incrementally expensive. Watch for momentum divergence.
75%+ ExhaustionInstitutional Stand-Down zone. Move is statistically unsustainable. High-probability reversion anticipated.
Smart Alert System
To eliminate "open air" signals, the built-in alert triggers only when two conditions are met:
Exhaustion crosses above the threshold (e.g., 75%).
Price is within the configured proximity (e.g., 0.5%) of a confirmed Pivot High or Low.
Honest Limitations
Momentum Regimes: During extreme "God-candle" breakouts or post-earnings gaps, price can remain exhausted for extended periods. Wait for a volatility shift before fading.
Heuristic Boundaries: The 25/50/75% thresholds are statistical estimates of stress, not direct measurements of internal dealer books. Use as confluence with Gamma Levels.
The Institutional Dealer Exhaustion indicator translates classical overbought/oversold logic into a statistically grounded framework. Rather than measuring price relative to itself (as RSI does), it measures the standardized deviation of price from its Volume Weighted Average Price (VWAP) anchor—the true breakeven reference point for the aggregate of institutional positions.
The result is an oscillator that is naturally regime-aware: a $5 move during a low-volatility consolidation registers as far more "exhausting" than the same move during high-volatility earnings expansion. This prevents the false signals that plague fixed-threshold oscillators in trending markets.
Mathematical Methodology
The core value (E) is derived by mapping the dispersion ratio through a Sigmoid function to ensure the oscillator stays within a 0–100 range without "clipping" at the top.
The Formula:
Exhaustion (E) = 100 * (1 - e^(-0.25 * x))
Raw Ratio (x) = |Price - Anchor| / (ATR * k)
Components:
Anchor: VWAP for intraday; falls back to SMA(20) on Daily+ timeframes.
ATR: Realized volatility used to normalize the distance across different market regimes.
Sigmoid Function: Maps the raw ratio to a 0–100 scale. This ensures that even small price deviations produce visible, proportional waves while extreme moves asymptotically approach 100%.
Zone InterpretationRange
0 – 25% Equilibrium Price is hugging the anchor. Dealers can manage delta cheaply. Trend continuation is favored.
25 – 50% NeutralDirectional bias is developing. Hedging costs are rising but manageable.
50 – 75% SaturationDealer hedging becomes incrementally expensive. Watch for momentum divergence.
75%+ ExhaustionInstitutional Stand-Down zone. Move is statistically unsustainable. High-probability reversion anticipated.
Smart Alert System
To eliminate "open air" signals, the built-in alert triggers only when two conditions are met:
Exhaustion crosses above the threshold (e.g., 75%).
Price is within the configured proximity (e.g., 0.5%) of a confirmed Pivot High or Low.
Honest Limitations
Momentum Regimes: During extreme "God-candle" breakouts or post-earnings gaps, price can remain exhausted for extended periods. Wait for a volatility shift before fading.
Heuristic Boundaries: The 25/50/75% thresholds are statistical estimates of stress, not direct measurements of internal dealer books. Use as confluence with Gamma Levels.
Notes de version
v1Notes de version
alert changesScript open-source
Dans l'esprit TradingView, le créateur de ce script l'a rendu open source afin que les traders puissent examiner et vérifier ses fonctionnalités. Bravo à l'auteur! Bien que vous puissiez l'utiliser gratuitement, n'oubliez pas que la republication du code est soumise à nos Règles.

Clause de non-responsabilité
Les informations et publications ne sont pas destinées à être, et ne constituent pas, des conseils ou recommandations financiers, d'investissement, de trading ou autres fournis ou approuvés par TradingView. Pour en savoir plus, consultez les Conditions d'utilisation.
Script open-source
Dans l'esprit TradingView, le créateur de ce script l'a rendu open source afin que les traders puissent examiner et vérifier ses fonctionnalités. Bravo à l'auteur! Bien que vous puissiez l'utiliser gratuitement, n'oubliez pas que la republication du code est soumise à nos Règles.
Clause de non-responsabilité
Les informations et publications ne sont pas destinées à être, et ne constituent pas, des conseils ou recommandations financiers, d'investissement, de trading ou autres fournis ou approuvés par TradingView. Pour en savoir plus, consultez les Conditions d'utilisation.