OPEN-SOURCE SCRIPT
AlgoYields - A
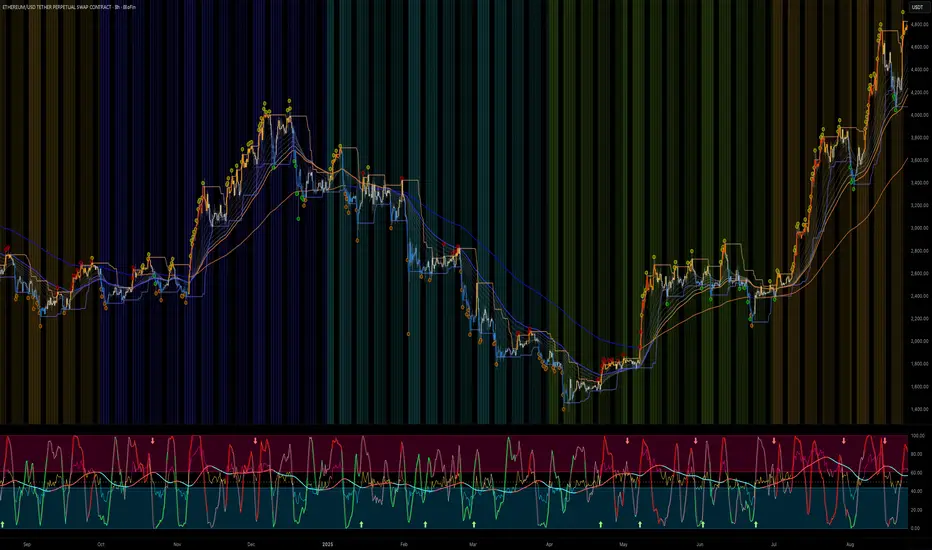
AlgoYields A — Everyday Overlay for Clean, Actionable Context
Please follow — more indicators & ideas coming soon!
Equipped with alerts and customizable styles, this overlay is designed for daily use: attractive look for fast reads, low noise, high signal. It blends a few trusted tools into a single, elegant view so you can track trend, momentum, and breakouts without overcrowding.
What’s inside
How to use it
––––––––––
Bullish Breakdowns ([color=#15b700]green[/color] dots) — often attractive dip-buys within uptrends.
Confirm with macro-EMA slope: steeper = stronger follow-through; flatting slope = take quicker profits and watch for potential rollover.

Bullish Breakouts ([color=#b7b100]yellow[/color] dots) — be selective. If RSI confirms strength, these can be solid for quick scalps; otherwise, beware “touch-and-fade” at the upper band.

Apply the same logic in reverse for shorts:
Bearish Breakouts ([color=#b50000]red[/color]) and Bearish Breakdowns ([color=#b56700]orange[/color]) favor short entries/continuations.

Inputs worth tweaking
Alerts
Choose from built-in signals (channel breaks, EMA crosses, significant RSI levels).
Notes & best practices
Please follow — more indicators & ideas coming soon!
Equipped with alerts and customizable styles, this overlay is designed for daily use: attractive look for fast reads, low noise, high signal. It blends a few trusted tools into a single, elegant view so you can track trend, momentum, and breakouts without overcrowding.
What’s inside
- Trading Session Backdrop
Quarter-tinted background (distinct color per quarter) for quick macro orientation; subtle week-to-week transparency shifts; CME pre-market, regular session, and post-market shading; weekends left clear.
Includes multiple curated color palettes. Ask if you want a custom theme. - EMA Cloud
A staircase of short EMAs for trend strength + two macro EMAs (defaults: 80 & 200). Macro EMAs auto-tint: blue when price is above, orange when below.
All lengths are user-configurable. - RSI-Derived Bar Colors
Contextual bar coloring by RSI level/zone to make strength/weakness instantly visible.
Comes with multiple palettes optimized for light/dark charts.
[]Price Channel & Breakouts
Select band source: Close (tight), HLC3 (medium), or High/Low (widest). Breakout dots print above/below bars and are color-coded by trend context:
[][color=#15b700]Green[/color]: break below lower band in an uptrend (buy-the-dip candidates).
[][color=#b7b100]Yellow[/color]: break above upper band in an uptrend (potential exhaustion / quick scalp).
[][color=#b56700]Orange[/color]: break below lower band in a downtrend (continuation shorts).- [color=#b50000]Red[/color]: break above upper band in a downtrend (fade-the-pop entries).
Buffer values can be tuned to reduce noise or enhance reactivity
How to use it
––––––––––
Bullish Breakdowns ([color=#15b700]green[/color] dots) — often attractive dip-buys within uptrends.
Confirm with macro-EMA slope: steeper = stronger follow-through; flatting slope = take quicker profits and watch for potential rollover.
Bullish Breakouts ([color=#b7b100]yellow[/color] dots) — be selective. If RSI confirms strength, these can be solid for quick scalps; otherwise, beware “touch-and-fade” at the upper band.
Apply the same logic in reverse for shorts:
Bearish Breakouts ([color=#b50000]red[/color]) and Bearish Breakdowns ([color=#b56700]orange[/color]) favor short entries/continuations.
Inputs worth tweaking
[]EMA lengths (short stack + macro 80/200 defaults).
[]RSI bar-color palette (pick for light/dark themes).
[]Channel source (Close / HLC3 / High-Low) and breakout buffer.
[]Session/quarter palette selection.
Alerts
Choose from built-in signals (channel breaks, EMA crosses, significant RSI levels).
Notes & best practices
[]Backtest breakouts per asset/timeframe to tune buffers and TP/SL targets.
[]Use level + slope together: RSI/EMA levels flag conditions; slope confirms impulse/continuation.- Let the EMA cloud and macro EMAs set bias; use RSI bars and breakout dots for timing.
Script open-source
Dans l'esprit TradingView, le créateur de ce script l'a rendu open source afin que les traders puissent examiner et vérifier ses fonctionnalités. Bravo à l'auteur! Bien que vous puissiez l'utiliser gratuitement, n'oubliez pas que la republication du code est soumise à nos Règles.

Clause de non-responsabilité
Les informations et publications ne sont pas destinées à être, et ne constituent pas, des conseils ou recommandations financiers, d'investissement, de trading ou autres fournis ou approuvés par TradingView. Pour en savoir plus, consultez les Conditions d'utilisation.
Script open-source
Dans l'esprit TradingView, le créateur de ce script l'a rendu open source afin que les traders puissent examiner et vérifier ses fonctionnalités. Bravo à l'auteur! Bien que vous puissiez l'utiliser gratuitement, n'oubliez pas que la republication du code est soumise à nos Règles.
Clause de non-responsabilité
Les informations et publications ne sont pas destinées à être, et ne constituent pas, des conseils ou recommandations financiers, d'investissement, de trading ou autres fournis ou approuvés par TradingView. Pour en savoir plus, consultez les Conditions d'utilisation.