Session Levels + Value Areas
Session Levels + Value Areas
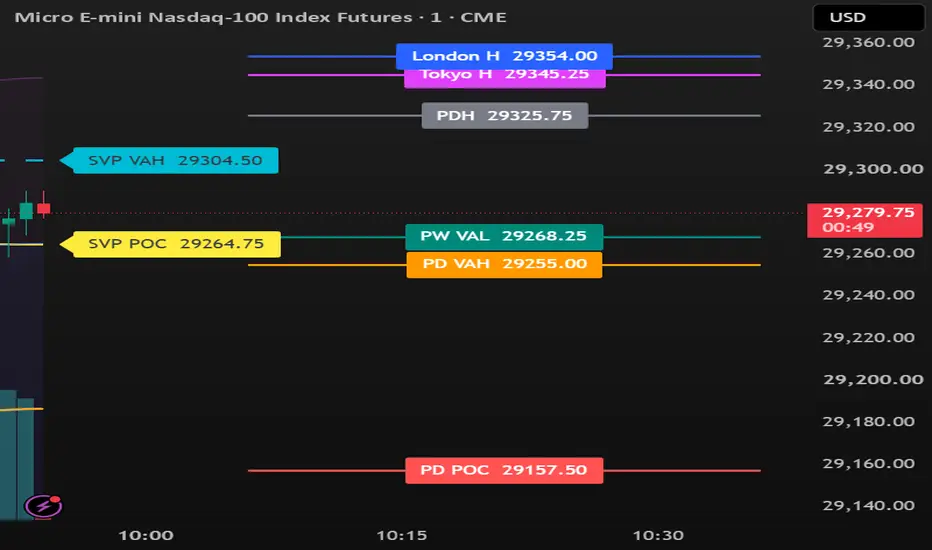
Plots the key reference levels many intraday futures traders watch, all on one chart with clean right-margin rays and labeled prices.
What it plots
Tokyo High / Low – default 18:00–04:00 ET
London High / Low – default 03:00–12:00 ET
Previous Day (NY session): High, Low, Value Area High (VAH), Value Area Low (VAL) and Point of Control (POC)
Previous Week (NY session): High, Low, VAH, VAL and POC
Current Session Profile: developing POC, VAH and VAL, built from every bar since the start of the Tokyo session and drawn from that bar to the current bar
How it works
Session highs and lows are tracked live while each session runs, then held until the next session starts. The value area levels come from a volume profile the script builds itself: the session’s price range is divided into rows, each bar’s volume is spread across the rows its high-low range covers, the POC is the row with the most volume, and the value area expands outward from the POC until it holds the chosen percentage of volume (default 70%). Previous day and previous week levels use NY session bars only (default 09:30–16:00 ET). The current session profile recalculates on the latest bar.
Display options
Rays in the right margin, with each label in the middle of its ray (keeps candles clear), or full lines with history
Labels show the level name and exact price, with adjustable size and position
Levels within 2 ticks of each other merge into one label (for example “PDH / PW VAH”) so labels never hide each other
Optional corner table listing every level and its price
Individual on/off toggles and colors for every level group
Settings
All session windows and the timezone, value area percentage, number of profile rows, line and label styling, and the ray and table options are adjustable.
Important notes
Works on intraday timeframes only. A 1–5 minute chart gives the most accurate profile.
Pine Script has no access to tick data, so the profile is an approximation: each bar’s volume is spread evenly across its range. POC, VAH and VAL will be close to, but not identical to, TradingView’s built-in Session Volume Profile. Row size, session choice and chart timeframe all affect the match.
Previous week levels need the previous full week of data loaded on your chart. If they’re missing, switch to a higher timeframe or scroll back to load more history.
Symbols with no volume data can’t produce value area levels.
Default session times are in Eastern Time and suit US index and metals futures (ES, NQ, MES, MNQ, GC, MGC and similar). Adjust them for other markets.
This script is for charting and educational purposes only. It does not provide trading signals or financial advice.
Plots the key reference levels many intraday futures traders watch, all on one chart with clean right-margin rays and labeled prices.
What it plots
Tokyo High / Low – default 18:00–04:00 ET
London High / Low – default 03:00–12:00 ET
Previous Day (NY session): High, Low, Value Area High (VAH), Value Area Low (VAL) and Point of Control (POC)
Previous Week (NY session): High, Low, VAH, VAL and POC
Current Session Profile: developing POC, VAH and VAL, built from every bar since the start of the Tokyo session and drawn from that bar to the current bar
How it works
Session highs and lows are tracked live while each session runs, then held until the next session starts. The value area levels come from a volume profile the script builds itself: the session’s price range is divided into rows, each bar’s volume is spread across the rows its high-low range covers, the POC is the row with the most volume, and the value area expands outward from the POC until it holds the chosen percentage of volume (default 70%). Previous day and previous week levels use NY session bars only (default 09:30–16:00 ET). The current session profile recalculates on the latest bar.
Display options
Rays in the right margin, with each label in the middle of its ray (keeps candles clear), or full lines with history
Labels show the level name and exact price, with adjustable size and position
Levels within 2 ticks of each other merge into one label (for example “PDH / PW VAH”) so labels never hide each other
Optional corner table listing every level and its price
Individual on/off toggles and colors for every level group
Settings
All session windows and the timezone, value area percentage, number of profile rows, line and label styling, and the ray and table options are adjustable.
Important notes
Works on intraday timeframes only. A 1–5 minute chart gives the most accurate profile.
Pine Script has no access to tick data, so the profile is an approximation: each bar’s volume is spread evenly across its range. POC, VAH and VAL will be close to, but not identical to, TradingView’s built-in Session Volume Profile. Row size, session choice and chart timeframe all affect the match.
Previous week levels need the previous full week of data loaded on your chart. If they’re missing, switch to a higher timeframe or scroll back to load more history.
Symbols with no volume data can’t produce value area levels.
Default session times are in Eastern Time and suit US index and metals futures (ES, NQ, MES, MNQ, GC, MGC and similar). Adjust them for other markets.
This script is for charting and educational purposes only. It does not provide trading signals or financial advice.

Clause de non-responsabilité
Les informations et publications ne sont pas destinées à être, et ne constituent pas, des conseils ou recommandations financiers, d'investissement, de trading ou autres fournis ou approuvés par TradingView. Pour en savoir plus, consultez les Conditions d'utilisation.
Clause de non-responsabilité
Les informations et publications ne sont pas destinées à être, et ne constituent pas, des conseils ou recommandations financiers, d'investissement, de trading ou autres fournis ou approuvés par TradingView. Pour en savoir plus, consultez les Conditions d'utilisation.