OPEN-SOURCE SCRIPT
Mis à jour RSI StdDev Trend Breakout
Overview
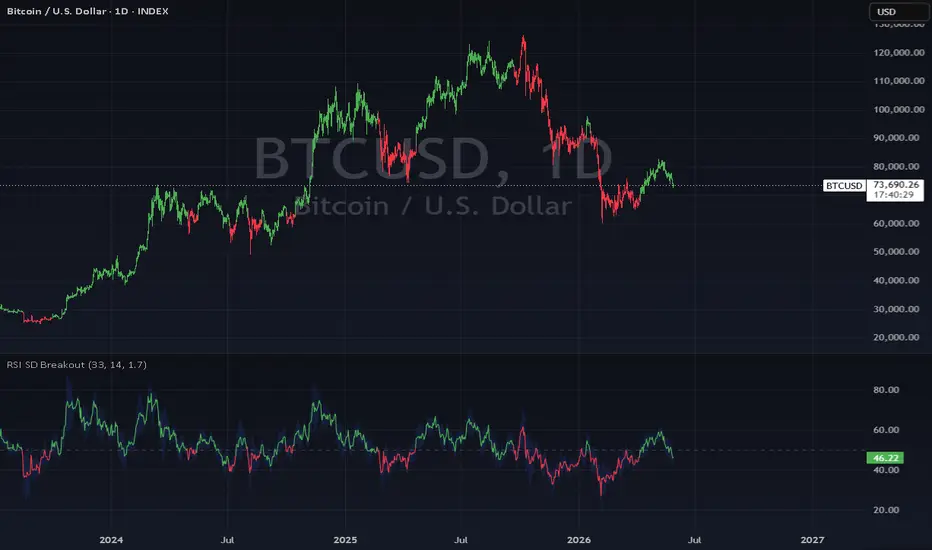
RSI StdDev Trend Breakout is a hybrid momentum and trend indicator built on the Relative Strength Index. It applies dynamic standard deviation bands directly to the RSI to detect meaningful breakout conditions, then uses the RSI midline as a trend filter to confirm bullish or bearish bias.
How It Works
The indicator calculates upper and lower standard deviation bands around the RSI. A bullish signal is triggered when the RSI breaks above the prior upper band while remaining above the midline, indicating upside momentum with trend confirmation. A bearish signal is triggered when the RSI breaks below the prior lower band while remaining below the midline, indicating downside momentum with trend confirmation. Once a bias is established, it persists until the opposing condition is met.
Visual Features
RSI line and candle colors update dynamically based on the current bullish or bearish state
Upper and lower standard deviation bands plotted with a filled channel for quick visual reference
Midline reference at 50 for trend context
Inputs
RSI Length - controls the RSI calculation period
StdDev Period - controls the lookback for standard deviation band calculation
StdDev Multiplier - adjusts the width of the bands
Alerts
Bullish: RSI > 50 and breaks above the upper standard deviation band
Bearish: RSI < 50 and breaks below the lower standard deviation band
RSI StdDev Trend Breakout is a hybrid momentum and trend indicator built on the Relative Strength Index. It applies dynamic standard deviation bands directly to the RSI to detect meaningful breakout conditions, then uses the RSI midline as a trend filter to confirm bullish or bearish bias.
How It Works
The indicator calculates upper and lower standard deviation bands around the RSI. A bullish signal is triggered when the RSI breaks above the prior upper band while remaining above the midline, indicating upside momentum with trend confirmation. A bearish signal is triggered when the RSI breaks below the prior lower band while remaining below the midline, indicating downside momentum with trend confirmation. Once a bias is established, it persists until the opposing condition is met.
Visual Features
RSI line and candle colors update dynamically based on the current bullish or bearish state
Upper and lower standard deviation bands plotted with a filled channel for quick visual reference
Midline reference at 50 for trend context
Inputs
RSI Length - controls the RSI calculation period
StdDev Period - controls the lookback for standard deviation band calculation
StdDev Multiplier - adjusts the width of the bands
Alerts
Bullish: RSI > 50 and breaks above the upper standard deviation band
Bearish: RSI < 50 and breaks below the lower standard deviation band
Notes de version
.Script open-source
Dans l'esprit TradingView, le créateur de ce script l'a rendu open source afin que les traders puissent examiner et vérifier ses fonctionnalités. Bravo à l'auteur! Bien que vous puissiez l'utiliser gratuitement, n'oubliez pas que la republication du code est soumise à nos Règles.

Clause de non-responsabilité
Les informations et publications ne sont pas destinées à être, et ne constituent pas, des conseils ou recommandations financiers, d'investissement, de trading ou autres fournis ou approuvés par TradingView. Pour en savoir plus, consultez les Conditions d'utilisation.
Script open-source
Dans l'esprit TradingView, le créateur de ce script l'a rendu open source afin que les traders puissent examiner et vérifier ses fonctionnalités. Bravo à l'auteur! Bien que vous puissiez l'utiliser gratuitement, n'oubliez pas que la republication du code est soumise à nos Règles.
Clause de non-responsabilité
Les informations et publications ne sont pas destinées à être, et ne constituent pas, des conseils ou recommandations financiers, d'investissement, de trading ou autres fournis ou approuvés par TradingView. Pour en savoir plus, consultez les Conditions d'utilisation.