OPEN-SOURCE SCRIPT
Mis à jour Bollinger Bands with 3SD Volume Segmentation
Purpose
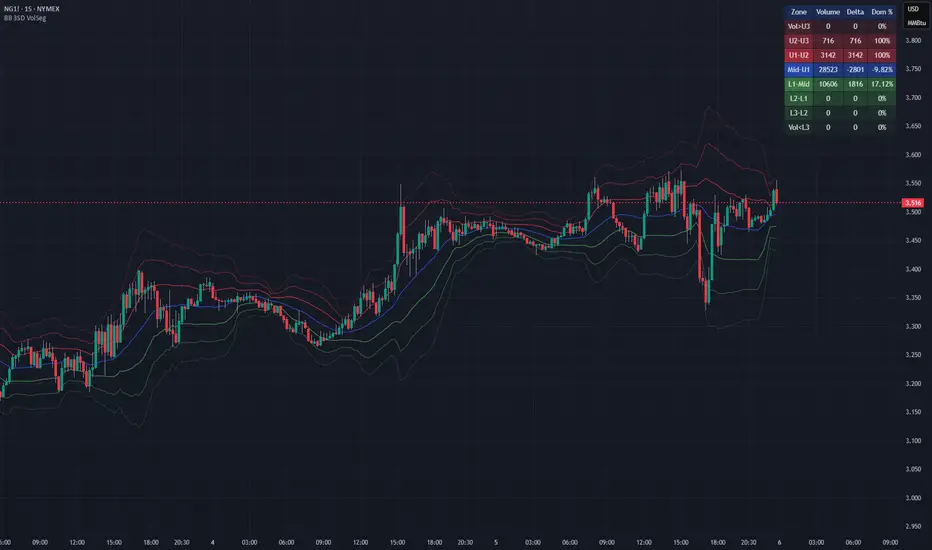
This script provides a structured way to analyze how real traded volume distributes across the different volatility zones defined by Bollinger Bands with three standard deviations, it reveals where activity concentrates, how pressure shifts between buyers and sellers, and how market participation behaves as price moves through expanding or contracting volatility regimes. The tool turns the bands into a mechanical segmentation system that exposes the microstructure hidden inside each volatility layer.
How it works
The script calculates Bollinger Bands at one, two, and three standard deviations, then assigns every bar’s volume to the correct volatility zone based on where price closed, it reconstructs buy and sell volume from candle behavior, computes delta as the difference between them, and aggregates these values over the chosen lookback window. Each zone displays total volume, delta, and a dominance percentage that expresses how strongly buyers or sellers controlled that region, all updated dynamically on the most recent bar. For example, if the Mid–U1 zone shows 28,450 contracts with a –2,728 delta and –9.59% dominance, that indicates mild seller control in a normally balanced rotation area, while the L1–Mid zone showing 10,606 contracts, +1,816 delta, and 17.12% dominance signals buyers absorbing pressure and defending the pullback.
Rationale
Volatility zones behave like natural boundaries where liquidity concentrates, where traders commit, hesitate, or get trapped, and where expansions or reversals often originate, so segmenting volume and delta by these zones provides a clearer picture of intent and pressure than raw volume alone. By quantifying how much buying or selling occurred in each volatility layer, the script helps identify continuation, absorption, exhaustion, and imbalance, giving traders a mechanical, objective map of market behavior rather than relying on subjective interpretation.
This script provides a structured way to analyze how real traded volume distributes across the different volatility zones defined by Bollinger Bands with three standard deviations, it reveals where activity concentrates, how pressure shifts between buyers and sellers, and how market participation behaves as price moves through expanding or contracting volatility regimes. The tool turns the bands into a mechanical segmentation system that exposes the microstructure hidden inside each volatility layer.
How it works
The script calculates Bollinger Bands at one, two, and three standard deviations, then assigns every bar’s volume to the correct volatility zone based on where price closed, it reconstructs buy and sell volume from candle behavior, computes delta as the difference between them, and aggregates these values over the chosen lookback window. Each zone displays total volume, delta, and a dominance percentage that expresses how strongly buyers or sellers controlled that region, all updated dynamically on the most recent bar. For example, if the Mid–U1 zone shows 28,450 contracts with a –2,728 delta and –9.59% dominance, that indicates mild seller control in a normally balanced rotation area, while the L1–Mid zone showing 10,606 contracts, +1,816 delta, and 17.12% dominance signals buyers absorbing pressure and defending the pullback.
Rationale
Volatility zones behave like natural boundaries where liquidity concentrates, where traders commit, hesitate, or get trapped, and where expansions or reversals often originate, so segmenting volume and delta by these zones provides a clearer picture of intent and pressure than raw volume alone. By quantifying how much buying or selling occurred in each volatility layer, the script helps identify continuation, absorption, exhaustion, and imbalance, giving traders a mechanical, objective map of market behavior rather than relying on subjective interpretation.
Notes de version
- Removed obsolete inputsNotes de version
- Added Volume% column and highlight for the most active SD bandScript open-source
Dans l'esprit TradingView, le créateur de ce script l'a rendu open source afin que les traders puissent examiner et vérifier ses fonctionnalités. Bravo à l'auteur! Bien que vous puissiez l'utiliser gratuitement, n'oubliez pas que la republication du code est soumise à nos Règles.

Clause de non-responsabilité
Les informations et publications ne sont pas destinées à être, et ne constituent pas, des conseils ou recommandations financiers, d'investissement, de trading ou autres fournis ou approuvés par TradingView. Pour en savoir plus, consultez les Conditions d'utilisation.
Script open-source
Dans l'esprit TradingView, le créateur de ce script l'a rendu open source afin que les traders puissent examiner et vérifier ses fonctionnalités. Bravo à l'auteur! Bien que vous puissiez l'utiliser gratuitement, n'oubliez pas que la republication du code est soumise à nos Règles.
Clause de non-responsabilité
Les informations et publications ne sont pas destinées à être, et ne constituent pas, des conseils ou recommandations financiers, d'investissement, de trading ou autres fournis ou approuvés par TradingView. Pour en savoir plus, consultez les Conditions d'utilisation.