OPEN-SOURCE SCRIPT
NFP High & Low Levels (Manual)
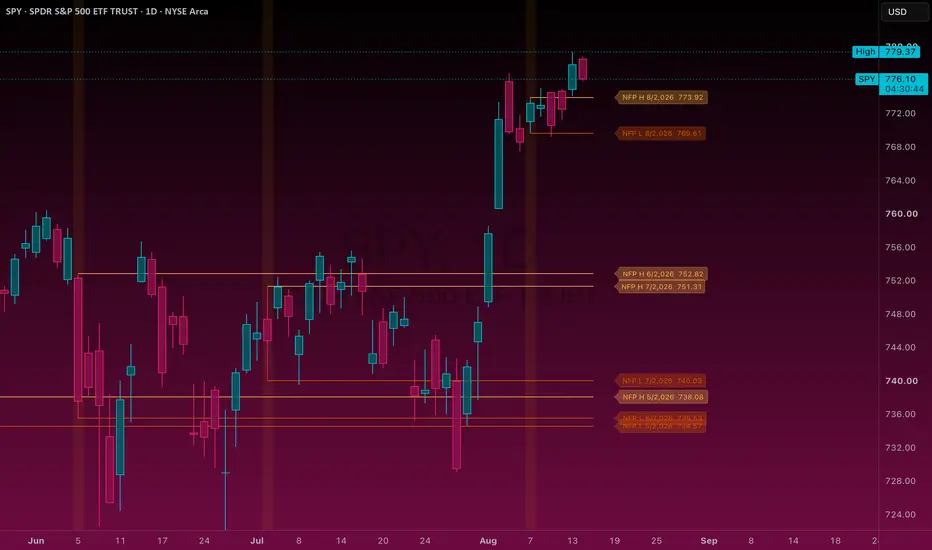
NFP High & Low Levels
This indicator automatically plots the High and Low of Non-Farm Payrolls (NFP) release days as horizontal levels on your chart. These levels often act as significant support and resistance in the days and weeks following the release.
How it works
On NFP days, the script captures the High and Low of the defined session (default 08:30–16:00 New York time on intraday charts).
On Daily, Weekly, and Monthly charts it uses the full daily candle High/Low.
Levels are drawn as horizontal lines that start on the NFP day and extend forward.
Labels appear just to the right of the latest candle showing the month and price.
Features
Works on all timeframes (intraday + higher timeframes)
Pre-loaded with 2025 and 2026 NFP dates (including known delayed releases)
Easy to add future NFP dates by editing the date list in the code
Customizable colors, label visibility, and number of levels shown
Clean visual design with light orange Highs and darker orange Lows
How to update for future NFP dates
Open the script in the Pine Editor and add new dates to the nfp_dates array using this format:
Pine Script®
Notes
NFP is usually released on the first Friday of the month, but can be delayed by holidays or government shutdowns.
The included date list already accounts for known delayed releases in 2025 and 2026.
Best used as a reference for key support/resistance zones rather than a standalone trading signal.
This indicator automatically plots the High and Low of Non-Farm Payrolls (NFP) release days as horizontal levels on your chart. These levels often act as significant support and resistance in the days and weeks following the release.
How it works
On NFP days, the script captures the High and Low of the defined session (default 08:30–16:00 New York time on intraday charts).
On Daily, Weekly, and Monthly charts it uses the full daily candle High/Low.
Levels are drawn as horizontal lines that start on the NFP day and extend forward.
Labels appear just to the right of the latest candle showing the month and price.
Features
Works on all timeframes (intraday + higher timeframes)
Pre-loaded with 2025 and 2026 NFP dates (including known delayed releases)
Easy to add future NFP dates by editing the date list in the code
Customizable colors, label visibility, and number of levels shown
Clean visual design with light orange Highs and darker orange Lows
How to update for future NFP dates
Open the script in the Pine Editor and add new dates to the nfp_dates array using this format:
Notes
NFP is usually released on the first Friday of the month, but can be delayed by holidays or government shutdowns.
The included date list already accounts for known delayed releases in 2025 and 2026.
Best used as a reference for key support/resistance zones rather than a standalone trading signal.
Script open-source
Dans l'esprit TradingView, le créateur de ce script l'a rendu open source afin que les traders puissent examiner et vérifier ses fonctionnalités. Bravo à l'auteur! Bien que vous puissiez l'utiliser gratuitement, n'oubliez pas que la republication du code est soumise à nos Règles.

Clause de non-responsabilité
Les informations et publications ne sont pas destinées à être, et ne constituent pas, des conseils ou recommandations financiers, d'investissement, de trading ou autres fournis ou approuvés par TradingView. Pour en savoir plus, consultez les Conditions d'utilisation.
Script open-source
Dans l'esprit TradingView, le créateur de ce script l'a rendu open source afin que les traders puissent examiner et vérifier ses fonctionnalités. Bravo à l'auteur! Bien que vous puissiez l'utiliser gratuitement, n'oubliez pas que la republication du code est soumise à nos Règles.
Clause de non-responsabilité
Les informations et publications ne sont pas destinées à être, et ne constituent pas, des conseils ou recommandations financiers, d'investissement, de trading ou autres fournis ou approuvés par TradingView. Pour en savoir plus, consultez les Conditions d'utilisation.