Mis à jour
XAUMO TIMING Dashboard
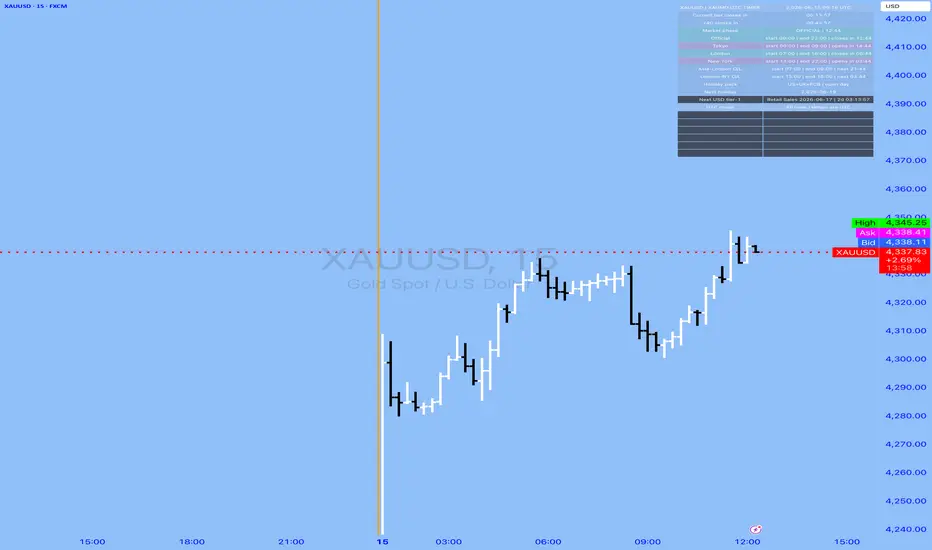
XAUMO Timing Dashboard
Open-source UTC timing dashboard for traders who want better awareness of bar timing, session timing, overlap windows, holidays, and major USD event timing directly on the chart.
This indicator was built around a practical idea:
many traders watch price very closely, but they do not always watch time with the same discipline.
A setup can look good technically, but timing still matters:
- the bar may be seconds away from closing
- the 4H candle may be about to roll
- London may be close to ending
- New York may be opening
- a session overlap may be starting
- a major USD event may be near
This script helps bring that time awareness onto the chart in one compact dashboard.
WHAT THE INDICATOR DOES
XAUMO Timing Dashboard displays:
- current bar countdown
- higher-timeframe countdown
- official session countdown
- pre-market countdown
- after-market countdown
- major session countdowns
- overlap countdowns
- holiday awareness
- next major hard-coded USD event timer
- visual controls for text size, text color, background colors, and visibility toggles
Everything is displayed in UTC to keep the workflow consistent across symbols, brokers, and locations.
WHY IT CAN BE USEFUL
This tool is designed for traders who want to reduce timing mistakes.
It can help answer questions like:
- How much time is left before this candle closes?
- How close is the 4H close?
- Is London still active?
- Is the London / New York overlap running?
- Is a holiday affecting market participation?
- Is a major USD event getting close?
It does not predict market direction.
It improves timing awareness.
WHO IT MAY HELP
This indicator may be useful for:
- intraday traders
- scalpers
- session traders
- gold traders
- FX traders
- CFD traders
- traders who work with UTC-based timing models
- traders who want session and macro timing visible on-chart
HOW IT IS CODED
The script is written in Pine Script and uses an on-chart dashboard table.
The logic includes:
- countdown calculations from the current bar and a selected higher timeframe
- configurable UTC windows for official, pre-market, and after-market phases
- session state detection for major trading sessions
- overlap detection between major sessions
- hard-coded holiday packs
- hard-coded USD tier-1 event timestamps
- user controls for visibility and styling so the board can stay minimal or detailed depending on preference
The goal is practical chart awareness, not signal generation.
IMPORTANT NOTES
- This is a timing and awareness tool, not a buy/sell signal tool.
- It does not replace your own execution model, risk management, or market analysis.
- Session definitions can vary by broker and symbol, so official / pre-market / after-market windows are user-editable.
- Holiday and economic-event data in this version are hard-coded and should be reviewed and refreshed over time.
- Always confirm major event timing with your own trusted calendar before live trading.
OPEN-SOURCE AND COLLABORATION
This script is published open-source so traders and coders can inspect the logic, learn from it, and adapt it to their own workflow.
Constructive collaboration, improvement ideas, and responsible open-source contributions are very welcome.
If you build on this script or reuse any part of it in a publication, please respect TradingView House Rules and provide proper credit where required.
FINAL THOUGHT
Charts show price.
XAUMO Timing Dashboard helps show timing.
For traders who care about candle close, higher-timeframe rollovers, session transitions, overlaps, holidays, and macro-event awareness, this tool is designed to make time more visible on the chart.
Open-source UTC timing dashboard for traders who want better awareness of bar timing, session timing, overlap windows, holidays, and major USD event timing directly on the chart.
This indicator was built around a practical idea:
many traders watch price very closely, but they do not always watch time with the same discipline.
A setup can look good technically, but timing still matters:
- the bar may be seconds away from closing
- the 4H candle may be about to roll
- London may be close to ending
- New York may be opening
- a session overlap may be starting
- a major USD event may be near
This script helps bring that time awareness onto the chart in one compact dashboard.
WHAT THE INDICATOR DOES
XAUMO Timing Dashboard displays:
- current bar countdown
- higher-timeframe countdown
- official session countdown
- pre-market countdown
- after-market countdown
- major session countdowns
- overlap countdowns
- holiday awareness
- next major hard-coded USD event timer
- visual controls for text size, text color, background colors, and visibility toggles
Everything is displayed in UTC to keep the workflow consistent across symbols, brokers, and locations.
WHY IT CAN BE USEFUL
This tool is designed for traders who want to reduce timing mistakes.
It can help answer questions like:
- How much time is left before this candle closes?
- How close is the 4H close?
- Is London still active?
- Is the London / New York overlap running?
- Is a holiday affecting market participation?
- Is a major USD event getting close?
It does not predict market direction.
It improves timing awareness.
WHO IT MAY HELP
This indicator may be useful for:
- intraday traders
- scalpers
- session traders
- gold traders
- FX traders
- CFD traders
- traders who work with UTC-based timing models
- traders who want session and macro timing visible on-chart
HOW IT IS CODED
The script is written in Pine Script and uses an on-chart dashboard table.
The logic includes:
- countdown calculations from the current bar and a selected higher timeframe
- configurable UTC windows for official, pre-market, and after-market phases
- session state detection for major trading sessions
- overlap detection between major sessions
- hard-coded holiday packs
- hard-coded USD tier-1 event timestamps
- user controls for visibility and styling so the board can stay minimal or detailed depending on preference
The goal is practical chart awareness, not signal generation.
IMPORTANT NOTES
- This is a timing and awareness tool, not a buy/sell signal tool.
- It does not replace your own execution model, risk management, or market analysis.
- Session definitions can vary by broker and symbol, so official / pre-market / after-market windows are user-editable.
- Holiday and economic-event data in this version are hard-coded and should be reviewed and refreshed over time.
- Always confirm major event timing with your own trusted calendar before live trading.
OPEN-SOURCE AND COLLABORATION
This script is published open-source so traders and coders can inspect the logic, learn from it, and adapt it to their own workflow.
Constructive collaboration, improvement ideas, and responsible open-source contributions are very welcome.
If you build on this script or reuse any part of it in a publication, please respect TradingView House Rules and provide proper credit where required.
FINAL THOUGHT
Charts show price.
XAUMO Timing Dashboard helps show timing.
For traders who care about candle close, higher-timeframe rollovers, session transitions, overlaps, holidays, and macro-event awareness, this tool is designed to make time more visible on the chart.
Notes de version
UPDATE — Session Start / End Clock AddedThis version improves the timing dashboard by adding clearer session clock visibility.
Previously, the dashboard displayed session countdowns such as “opens in” or “closes in”. This update adds the actual session start and end time directly inside the relevant rows, so traders can immediately see not only how much time is left, but also when the session started and when it ends.
Example output:
London | start 07:00 | end 16:00 | closes in 02:14
New York | start 13:00 | end 22:00 | opens in 01:35
What was added:
* Exact session start time display
* Exact session end time display
* Optional toggle to show or hide the session clock
* Updated rows for Official Session, Pre-Market, After-Market, Tokyo, London, New York, and session overlaps
* Better timing context for traders watching session transitions and market overlap windows
The purpose of this update is to make session timing easier to read directly from the chart.
This indicator remains a timing and awareness tool only. It does not generate buy or sell signals, does not predict market direction, and does not provide financial advice. Traders should always use their own analysis, risk management, and independent judgment.

لو عايز تبقى واحد من اللي بيفهموا في الدهب وبيكسبوا من السوق صح،
🎯 للدهب والفرص الحقيقية تابعنا من هنا:
For gold updates & smart trades 👇
t.me/+kEj0YpkDJlA1YWM0
You're welcome to join my Telegram channel
انضم وابقى من اللعيبة مش من الجمهور
🎯 للدهب والفرص الحقيقية تابعنا من هنا:
For gold updates & smart trades 👇
t.me/+kEj0YpkDJlA1YWM0
You're welcome to join my Telegram channel
انضم وابقى من اللعيبة مش من الجمهور
Clause de non-responsabilité
Les informations et publications ne sont pas destinées à être, et ne constituent pas, des conseils ou recommandations financiers, d'investissement, de trading ou autres fournis ou approuvés par TradingView. Pour en savoir plus, consultez les Conditions d'utilisation.
لو عايز تبقى واحد من اللي بيفهموا في الدهب وبيكسبوا من السوق صح،
🎯 للدهب والفرص الحقيقية تابعنا من هنا:
For gold updates & smart trades 👇
t.me/+kEj0YpkDJlA1YWM0
You're welcome to join my Telegram channel
انضم وابقى من اللعيبة مش من الجمهور
🎯 للدهب والفرص الحقيقية تابعنا من هنا:
For gold updates & smart trades 👇
t.me/+kEj0YpkDJlA1YWM0
You're welcome to join my Telegram channel
انضم وابقى من اللعيبة مش من الجمهور
Clause de non-responsabilité
Les informations et publications ne sont pas destinées à être, et ne constituent pas, des conseils ou recommandations financiers, d'investissement, de trading ou autres fournis ou approuvés par TradingView. Pour en savoir plus, consultez les Conditions d'utilisation.