OPEN-SOURCE SCRIPT
Mis à jour PCRXS Forecast Engine v1.0
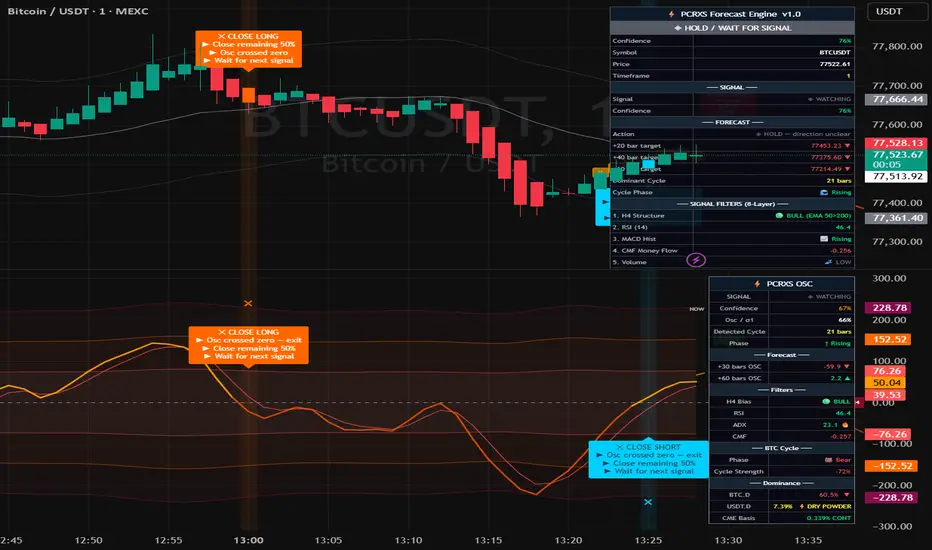
⚡ PCRXS Forecast Engine — Price Forecast
The dashed orange lines extending to the right of the current bar are a composite mathematical projection of where price is likely to go, built from 10 components that run simultaneously:
ComponentWhat it capturesLinear regression trendThe current slope and direction of the marketShort cycleDominant swing cycle auto-detected from your chart's pivot highsMedium cycle3× the short cycle — the bigger swing structureBTC halving cycle4-year model anchored to Apr 2024 halvingDXY inverseDollar strength drag/tailwind on cryptoS&P 500Risk-on/off correlation nudgeGoldSafe haven signal — rising gold dampens cryptoFear & GreedATR-based volatility proxyUSDT.D flowStablecoin capital entering or leaving cryptoCME futures basisInstitutional sentiment (contango vs backwardation)
What you see on the chart:
🟠 Dashed orange line — the composite forecast path
Dotted lines above/below — confidence bands that widen with distance (wider = less certain)
🟢 Green labels at troughs — predicted low points with date and price → where to Close Short / Buy Long
🔴 Red labels at peaks — predicted high points with date and price → where to Close Long / Buy Short
↑ ↓ labels on zero line — where the oscillator is forecast to cross zero → anticipated entry zones
The confidence % shown on each label reflects how many of the 19 market factors are pointing in the same direction. Above 70% is high conviction. Below 50% means mixed signals — treat the forecast as directional guidance only, not a guarantee.
The dashed orange lines extending to the right of the current bar are a composite mathematical projection of where price is likely to go, built from 10 components that run simultaneously:
ComponentWhat it capturesLinear regression trendThe current slope and direction of the marketShort cycleDominant swing cycle auto-detected from your chart's pivot highsMedium cycle3× the short cycle — the bigger swing structureBTC halving cycle4-year model anchored to Apr 2024 halvingDXY inverseDollar strength drag/tailwind on cryptoS&P 500Risk-on/off correlation nudgeGoldSafe haven signal — rising gold dampens cryptoFear & GreedATR-based volatility proxyUSDT.D flowStablecoin capital entering or leaving cryptoCME futures basisInstitutional sentiment (contango vs backwardation)
What you see on the chart:
🟠 Dashed orange line — the composite forecast path
Dotted lines above/below — confidence bands that widen with distance (wider = less certain)
🟢 Green labels at troughs — predicted low points with date and price → where to Close Short / Buy Long
🔴 Red labels at peaks — predicted high points with date and price → where to Close Long / Buy Short
↑ ↓ labels on zero line — where the oscillator is forecast to cross zero → anticipated entry zones
The confidence % shown on each label reflects how many of the 19 market factors are pointing in the same direction. Above 70% is high conviction. Below 50% means mixed signals — treat the forecast as directional guidance only, not a guarantee.
Notes de version
Minor cosmetic fixesScript open-source
Dans l'esprit TradingView, le créateur de ce script l'a rendu open source afin que les traders puissent examiner et vérifier ses fonctionnalités. Bravo à l'auteur! Bien que vous puissiez l'utiliser gratuitement, n'oubliez pas que la republication du code est soumise à nos Règles.

Clause de non-responsabilité
Les informations et publications ne sont pas destinées à être, et ne constituent pas, des conseils ou recommandations financiers, d'investissement, de trading ou autres fournis ou approuvés par TradingView. Pour en savoir plus, consultez les Conditions d'utilisation.
Script open-source
Dans l'esprit TradingView, le créateur de ce script l'a rendu open source afin que les traders puissent examiner et vérifier ses fonctionnalités. Bravo à l'auteur! Bien que vous puissiez l'utiliser gratuitement, n'oubliez pas que la republication du code est soumise à nos Règles.
Clause de non-responsabilité
Les informations et publications ne sont pas destinées à être, et ne constituent pas, des conseils ou recommandations financiers, d'investissement, de trading ou autres fournis ou approuvés par TradingView. Pour en savoir plus, consultez les Conditions d'utilisation.