Drawdown Path With A Defensive Exit & Re-Entry Position
Understanding drawdown is an important part of managing risk and evaluating an investment’s path.
Many guides explain the concept, but I wanted a way to visualise drawdown for the security I’m charting and see how a simple exit-and-re-entry rule behaves.
The core idea is simple.
Gains and losses are not symmetric in percentage terms.
A loss reduces your capital base, so the percentage gain needed to recover is greater than the percentage lost.
If you take away one visual, make it this:
a 50% loss needs a 100% gain to break even; a 75% loss needs a 300% gain. The deeper the loss, the larger the percentage recovery required.
The relationship is nonlinear, not exponential.
The required recovery rises without bound as the loss approaches 100%.
You need to regain the dollars lost, but measure that recovery against the smaller amount of capital that remains.
Drawdown | Gain needed to recover
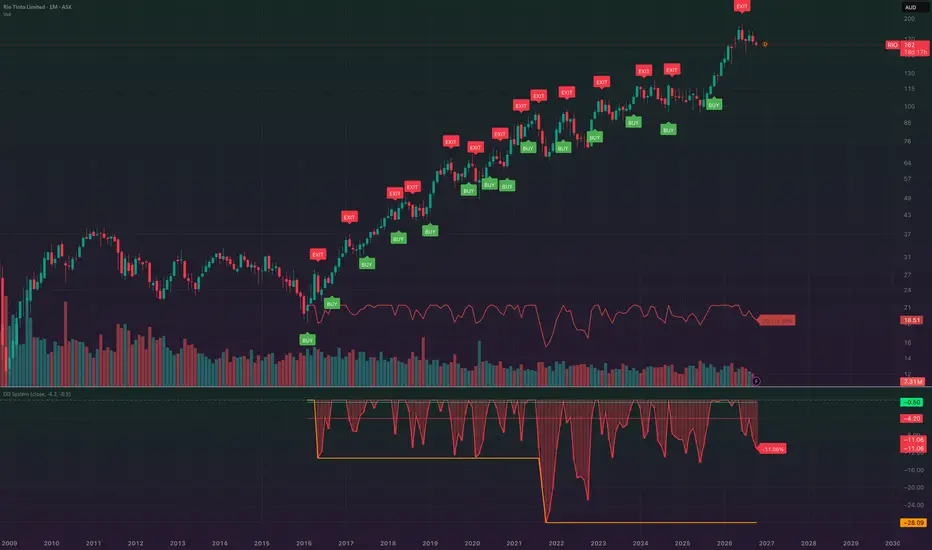
The charts below show the drawdown path for the charted security. The indicator measures each selected price against its highest value since the chosen start date.

The drawdown path is also projected onto the main price chart.
In the settings, you can change the start date and compare how the path looks over different periods.

Here’s another example using an earlier start date.

The script also marks a simple exit-on-decline, re-enter-on-recovery rule. You can change the thresholds in the indicator settings or edit their defaults in the source:
Pine Script®
For this rule, the EXIT threshold must be lower than the BUY threshold:
−4.2% triggers the exit during a deeper drawdown, while −0.5% triggers re-entry after recovery.
The first confirmed bar on or after the selected start date produces an initial BUY signal.
After that, the script marks an EXIT when drawdown reaches or passes the exit threshold, and a BUY when drawdown recovers to the entry threshold.
This rule waits for a defined recovery instead of trying to identify the exact bottom: it may avoid some further declines, but it can also miss part of a rebound.
This is a threshold-based exposure rule, not an offsetting hedge or a portfolio optimisation model.
The signals do not guarantee execution prices or cap losses, and any performance assessment should account for costs, slippage, and execution assumptions.
Many guides explain the concept, but I wanted a way to visualise drawdown for the security I’m charting and see how a simple exit-and-re-entry rule behaves.
The core idea is simple.
Imagine a stock at $1 that rises to $2, a 100% gain. The peak is now $2. If the price falls back to $1, that is a 50% drawdown from the peak. A 50% gain from $1 gets you to $1.50; you need a 100% gain to return to $2.
Gains and losses are not symmetric in percentage terms.
A loss reduces your capital base, so the percentage gain needed to recover is greater than the percentage lost.
If you take away one visual, make it this:
a 50% loss needs a 100% gain to break even; a 75% loss needs a 300% gain. The deeper the loss, the larger the percentage recovery required.
The relationship is nonlinear, not exponential.
The required recovery rises without bound as the loss approaches 100%.
You need to regain the dollars lost, but measure that recovery against the smaller amount of capital that remains.
Drawdown | Gain needed to recover
- 05% | 5.26%
- 10% | 11.11%
- 15% | 17.65%
- 20% | 25%
- 25% | 33.33%
- 30% | 42.86%
- 35% | 53.85%
- 40% | 66.67%
- 45% | 81.82%
- 50% | 100%
- 55% | 122.22%
- 60% | 150%
- 65% | 185.71%
- 70% | 233.33%
- 75% | 300%
- 80% | 400%
- 85% | 566.67%
- 90% | 900%
- 95% | 1,900%
The charts below show the drawdown path for the charted security. The indicator measures each selected price against its highest value since the chosen start date.
The drawdown path is also projected onto the main price chart.
In the settings, you can change the start date and compare how the path looks over different periods.
Here’s another example using an earlier start date.
The script also marks a simple exit-on-decline, re-enter-on-recovery rule. You can change the thresholds in the indicator settings or edit their defaults in the source:
For this rule, the EXIT threshold must be lower than the BUY threshold:
−4.2% triggers the exit during a deeper drawdown, while −0.5% triggers re-entry after recovery.
In other words, exit deeper in the decline; buy closer to the peak.
The first confirmed bar on or after the selected start date produces an initial BUY signal.
After that, the script marks an EXIT when drawdown reaches or passes the exit threshold, and a BUY when drawdown recovers to the entry threshold.
This rule waits for a defined recovery instead of trying to identify the exact bottom: it may avoid some further declines, but it can also miss part of a rebound.
This is a threshold-based exposure rule, not an offsetting hedge or a portfolio optimisation model.
The signals do not guarantee execution prices or cap losses, and any performance assessment should account for costs, slippage, and execution assumptions.
Surviving the downside gives compounding more room to work on the upside.

Clause de non-responsabilité
Les informations et publications ne sont pas destinées à être, et ne constituent pas, des conseils ou recommandations financiers, d'investissement, de trading ou autres fournis ou approuvés par TradingView. Pour en savoir plus, consultez les Conditions d'utilisation.
Clause de non-responsabilité
Les informations et publications ne sont pas destinées à être, et ne constituent pas, des conseils ou recommandations financiers, d'investissement, de trading ou autres fournis ou approuvés par TradingView. Pour en savoir plus, consultez les Conditions d'utilisation.