OPEN-SOURCE SCRIPT
Displaced Donchian Breakout [NJ]
✧ OVERVIEW ✧
Displaced Donchian Breakout is a trend-following breakout indicator that builds Donchian-style bands from a lookback window placed further in the past instead of from the most recent candles.
Upper band is the highest high and lower band is the lowest low of a selected group of older candles. Recent price action is skipped, so the bands represent an earlier price range rather than the latest swing highs and lows.
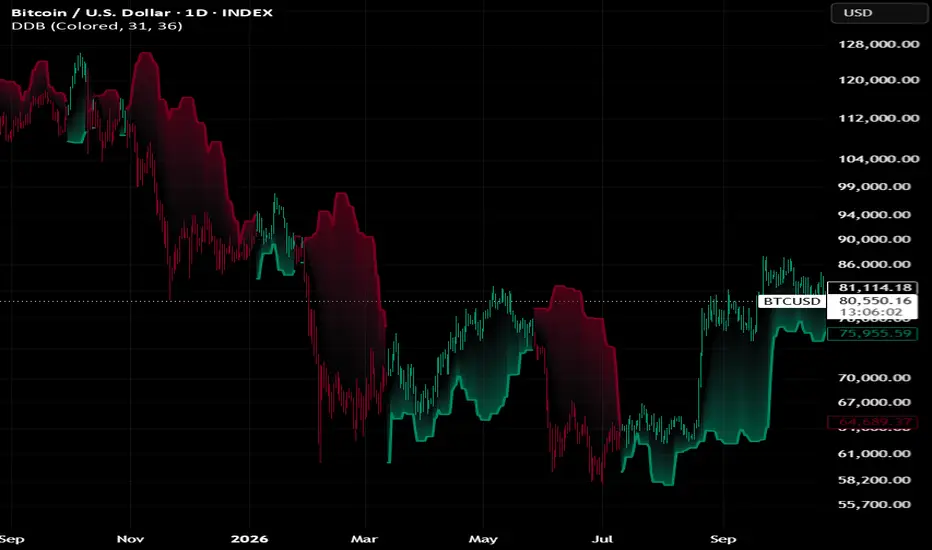
Price breaking beyond the displaced bands determines the current bullish or bearish condition, which is displayed using colored candles, an active band and a gradient glow.
✧ SETTINGS ✧
Color Mode
Switches between colored and neutral visualization.
Color Candles
Shows or hides candle coloring based on the current signal.
Start Length
Controls how many recent bars are skipped before the lookback window begins.
End Length
Controls how far back the lookback window ends. The number of candles in the window equals End Length minus Start Length.
✧ HOW IT WORKS ✧
Displaced Lookback Window
A classic Donchian Channel uses the highest high and lowest low of the most recent candles. This indicator skips the most recent candles and only looks at an older section of price.
Upper Band = Highest high of the candles from Start Length + 1 to End Length bars ago
Lower Band = Lowest low of the candles from Start Length + 1 to End Length bars ago
Band Behavior
Because the window moves forward one candle at a time, the bands follow how price behaved in the past rather than reacting to every new high or low.
When the older window contained a strong move or a volatile period, the bands widen. When it contained a quiet range, the bands tighten.
Signal Logic
A bullish condition is activated when the high of a candle moves above the upper band.
A bearish condition is activated when the low of a candle moves below the lower band.
If both happen on the same candle, the bearish condition takes priority.
Active condition remains unchanged until the opposite condition occurs.
✧ VISUALIZATION ✧
Green represents a bullish condition.
Red represents a bearish condition.
Neutral mode displays the same conditions using light and dark shades.
During a bullish condition, lower band is displayed in green.
During a bearish condition, upper band is displayed in red.
A gradient glow fills the area between the active band and a 10-period simple moving average of closing price. It is strongest at the band and fades toward price.
Same signal colors can optionally be applied directly to the chart candles.
✧ USAGE ✧
Displaced Donchian Breakout can be used to identify:
Bullish and bearish trend conditions
Breakouts beyond previous price ranges
Trailing support and resistance levels
Directional market bias
Trend confirmation
Additional confirmation for other technical analysis
Using an older price range is designed to require price to move beyond where the market traded earlier, rather than reacting to short-term swing highs and lows.
As with any technical indicator, it is best used alongside other forms of analysis rather than as a standalone entry or exit signal.
Script open-source
Dans l'esprit TradingView, le créateur de ce script l'a rendu open source afin que les traders puissent examiner et vérifier ses fonctionnalités. Bravo à l'auteur! Bien que vous puissiez l'utiliser gratuitement, n'oubliez pas que la republication du code est soumise à nos Règles.

Clause de non-responsabilité
Les informations et publications ne sont pas destinées à être, et ne constituent pas, des conseils ou recommandations financiers, d'investissement, de trading ou autres fournis ou approuvés par TradingView. Pour en savoir plus, consultez les Conditions d'utilisation.
Script open-source
Dans l'esprit TradingView, le créateur de ce script l'a rendu open source afin que les traders puissent examiner et vérifier ses fonctionnalités. Bravo à l'auteur! Bien que vous puissiez l'utiliser gratuitement, n'oubliez pas que la republication du code est soumise à nos Règles.
Clause de non-responsabilité
Les informations et publications ne sont pas destinées à être, et ne constituent pas, des conseils ou recommandations financiers, d'investissement, de trading ou autres fournis ou approuvés par TradingView. Pour en savoir plus, consultez les Conditions d'utilisation.