OPEN-SOURCE SCRIPT
Previous Periods Highs and Lows + Labels
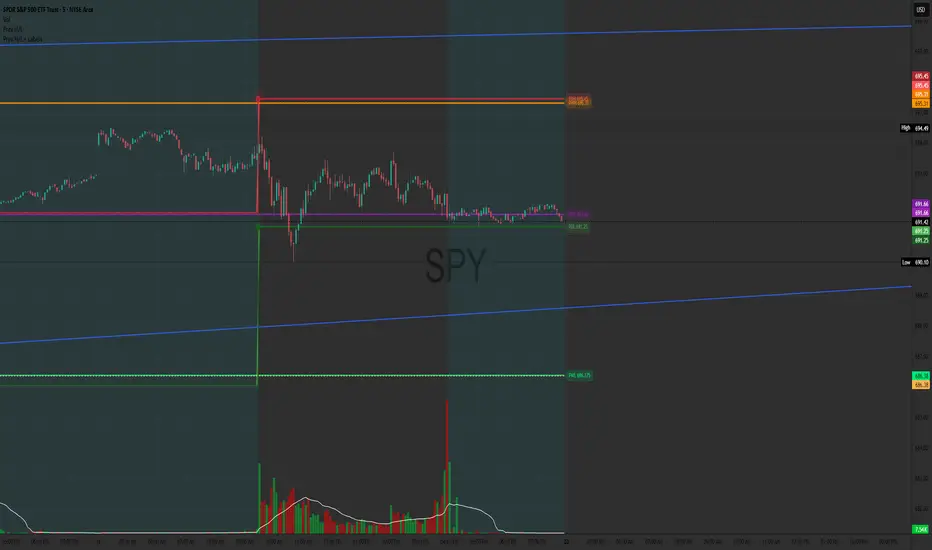
This indicator plots the high and low prices from the previous Day, Week, and Month as horizontal lines on any timeframe chart. It provides clear visual reference to key historical support and resistance levels commonly used by traders for: breakout and reversal identification
stop-loss placement
target setting
Features include distinct colors for each period and optional price labels displayed on the right side of the chart for quick reference.Simple, non-repainting, and optimized for both intraday and swing trading setups.
stop-loss placement
target setting
Features include distinct colors for each period and optional price labels displayed on the right side of the chart for quick reference.Simple, non-repainting, and optimized for both intraday and swing trading setups.
Script open-source
Dans l'esprit TradingView, le créateur de ce script l'a rendu open source afin que les traders puissent examiner et vérifier ses fonctionnalités. Bravo à l'auteur! Bien que vous puissiez l'utiliser gratuitement, n'oubliez pas que la republication du code est soumise à nos Règles.

Clause de non-responsabilité
Les informations et publications ne sont pas destinées à être, et ne constituent pas, des conseils ou recommandations financiers, d'investissement, de trading ou autres fournis ou approuvés par TradingView. Pour en savoir plus, consultez les Conditions d'utilisation.
Script open-source
Dans l'esprit TradingView, le créateur de ce script l'a rendu open source afin que les traders puissent examiner et vérifier ses fonctionnalités. Bravo à l'auteur! Bien que vous puissiez l'utiliser gratuitement, n'oubliez pas que la republication du code est soumise à nos Règles.
Clause de non-responsabilité
Les informations et publications ne sont pas destinées à être, et ne constituent pas, des conseils ou recommandations financiers, d'investissement, de trading ou autres fournis ou approuvés par TradingView. Pour en savoir plus, consultez les Conditions d'utilisation.