Taught to Trade - ATR Trailing Stop with Flip Audit
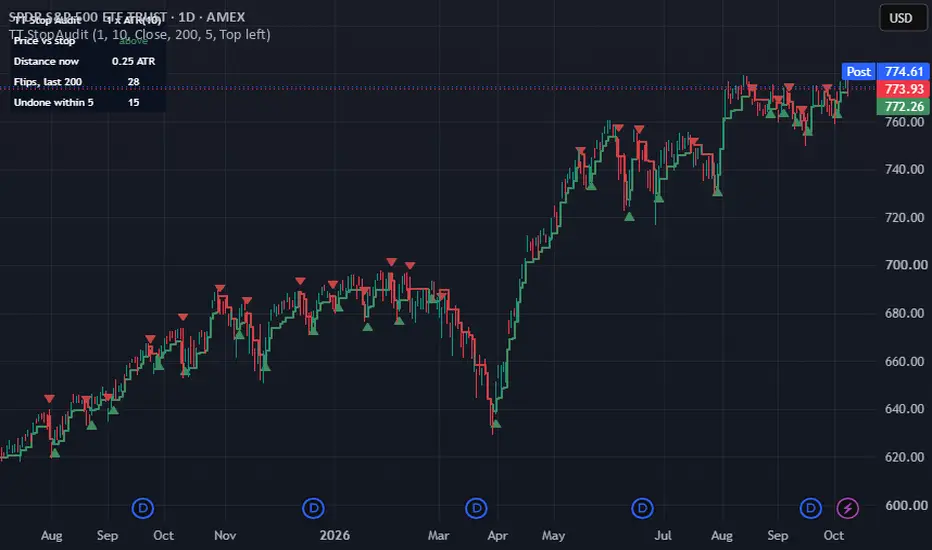
A trailing stop held a set number of ATRs from price, plus an audit of how it behaves: where the stop is, whether a flip was confirmed at the close, and how often flips were undone within a few bars. The stop rule is the one popularised by UT Bot Alerts by QuantNomad, itself built on UT Bot by Yo_adriiiiaan (who credits HPotter); credit to all three. This script is written from scratch. The audit features are what it is for.
HOW THE STOP WORKS
On each bar the distance is: Distance x ATR(ATR length).
- If price is above the previous stop on this bar and the last one, the stop can only rise: it moves up to price minus the distance, never down.
- If price is below the previous stop on both bars, the stop can only fall.
- Otherwise price has just crossed the previous stop, and the stop restarts on the other side.
A flip is the bar where price crosses the stop. Flips always alternate up and down. At Distance = 1 and ATR length = 10 on the close, this script draws the same stop and the same flip bars as UT Bot Alerts.
WHAT IT ADDS
- The stop line is drawn. UT Bot Alerts only colours bars and places labels, so you never see where the stop is.
- Distance accepts fractions (1.5, 2.25). The original input takes whole numbers only.
- Confirm flips on bar close (on by default). A flip that appears while the bar is still open is drawn as a grey circle. If price moves back before the close, the circle disappears, and you can see that a mid-bar flip was not a flip. The alerts follow the same setting.
- Heikin Ashi is computed inside the script from the chart's own bars. Its close is (open + high + low + close) / 4 of each real bar. An option measures ATR on the same Heikin Ashi candles instead of mixing the two, which the original does.
- Midpoint source: (high + low) / 2, the price Supertrend uses, so you can compare the two approaches on one chart.
- A panel shows how far price is from the stop right now in ATRs, how many flips happened in the last N bars, and how many of those were undone within a few bars. That last number is the cost of a tight setting, shown directly.
SETTINGS
- Distance (x ATR), default 1: how much give-back the stop allows. Larger means fewer flips, each one later.
- ATR length, default 10: how fast the distance reacts to a change in volatility.
- Price the stop follows: Close, Heikin Ashi close, or Midpoint.
- Confirm flips on bar close, Draw the stop line, Mark flips.
- Panel: window length, quick-reversal threshold, position.
ALERTS
Two alert conditions: price crossed above the stop, and price crossed below the stop. You create and manage your own alerts; the script does not send anything.
WHERE IT FAILS
- Every flip is late by construction: price has to give back roughly the distance from its best close before the stop is crossed.
- At tight settings an ordinary pullback flips it. Watch the "undone within" count in the panel before trusting a setting.
- It has two states and no neutral one. It is always on one side, trending or not.
- With confirmation off, a flip seen during the bar can vanish at the close.
- A setting chosen by looking at one chart was fitted to that chart. Change the symbol, the timeframe or the year and the picture changes.
- A flip records that price crossed a stop. Treating it as the start of a trend is a separate claim, and nothing in the script tests it.
Educational tool only - not investment advice. Trading involves substantial risk of loss. Past behaviour of any indicator says nothing certain about the future.
HOW THE STOP WORKS
On each bar the distance is: Distance x ATR(ATR length).
- If price is above the previous stop on this bar and the last one, the stop can only rise: it moves up to price minus the distance, never down.
- If price is below the previous stop on both bars, the stop can only fall.
- Otherwise price has just crossed the previous stop, and the stop restarts on the other side.
A flip is the bar where price crosses the stop. Flips always alternate up and down. At Distance = 1 and ATR length = 10 on the close, this script draws the same stop and the same flip bars as UT Bot Alerts.
WHAT IT ADDS
- The stop line is drawn. UT Bot Alerts only colours bars and places labels, so you never see where the stop is.
- Distance accepts fractions (1.5, 2.25). The original input takes whole numbers only.
- Confirm flips on bar close (on by default). A flip that appears while the bar is still open is drawn as a grey circle. If price moves back before the close, the circle disappears, and you can see that a mid-bar flip was not a flip. The alerts follow the same setting.
- Heikin Ashi is computed inside the script from the chart's own bars. Its close is (open + high + low + close) / 4 of each real bar. An option measures ATR on the same Heikin Ashi candles instead of mixing the two, which the original does.
- Midpoint source: (high + low) / 2, the price Supertrend uses, so you can compare the two approaches on one chart.
- A panel shows how far price is from the stop right now in ATRs, how many flips happened in the last N bars, and how many of those were undone within a few bars. That last number is the cost of a tight setting, shown directly.
SETTINGS
- Distance (x ATR), default 1: how much give-back the stop allows. Larger means fewer flips, each one later.
- ATR length, default 10: how fast the distance reacts to a change in volatility.
- Price the stop follows: Close, Heikin Ashi close, or Midpoint.
- Confirm flips on bar close, Draw the stop line, Mark flips.
- Panel: window length, quick-reversal threshold, position.
ALERTS
Two alert conditions: price crossed above the stop, and price crossed below the stop. You create and manage your own alerts; the script does not send anything.
WHERE IT FAILS
- Every flip is late by construction: price has to give back roughly the distance from its best close before the stop is crossed.
- At tight settings an ordinary pullback flips it. Watch the "undone within" count in the panel before trusting a setting.
- It has two states and no neutral one. It is always on one side, trending or not.
- With confirmation off, a flip seen during the bar can vanish at the close.
- A setting chosen by looking at one chart was fitted to that chart. Change the symbol, the timeframe or the year and the picture changes.
- A flip records that price crossed a stop. Treating it as the start of a trend is a separate claim, and nothing in the script tests it.
Educational tool only - not investment advice. Trading involves substantial risk of loss. Past behaviour of any indicator says nothing certain about the future.

Free Pine Script teardowns, a repaint checker and honest tools: taughttotrade.com (educational only, not financial advice)
Clause de non-responsabilité
Les informations et publications ne sont pas destinées à être, et ne constituent pas, des conseils ou recommandations financiers, d'investissement, de trading ou autres fournis ou approuvés par TradingView. Pour en savoir plus, consultez les Conditions d'utilisation.
Free Pine Script teardowns, a repaint checker and honest tools: taughttotrade.com (educational only, not financial advice)
Clause de non-responsabilité
Les informations et publications ne sont pas destinées à être, et ne constituent pas, des conseils ou recommandations financiers, d'investissement, de trading ou autres fournis ou approuvés par TradingView. Pour en savoir plus, consultez les Conditions d'utilisation.