Mis à jour
Distribution Days & Follow Thru Day Counter
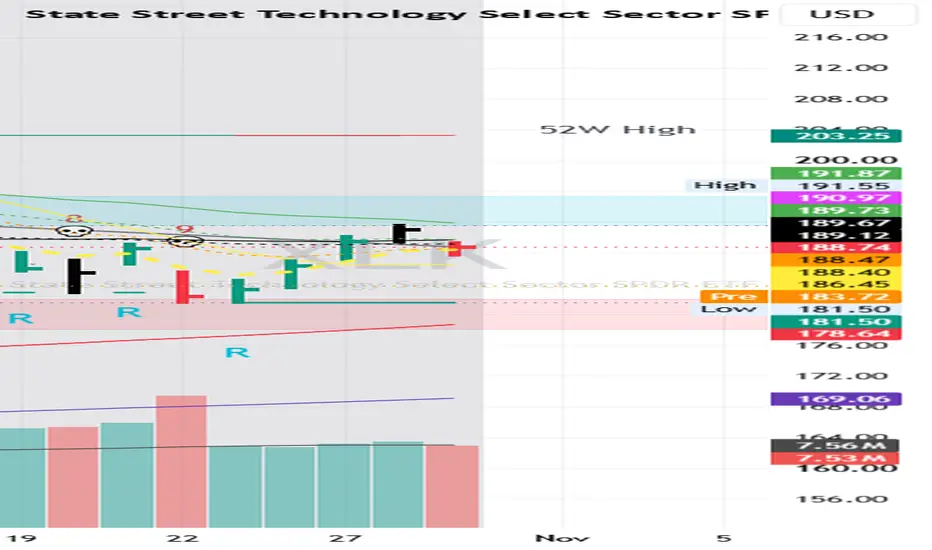
Distribution & Follow-Through Days Counter
Distribution & Follow-Through Days Counter is an independent Pine Script v6 indicator designed to visualize several publicly described William O'Neil / IBD-style market-timing concepts on daily charts. Rather than displaying isolated signals, the indicator combines Market Correction, Rally Attempt, Follow-Through Day and Distribution analysis into a state-based market-direction model.
OVERVIEW
The model follows three primary market states: CORRECTION, RALLY ATTEMPT and CONFIRMED UPTREND.
1. MARKET CORRECTION
The model begins in a Correction state and tracks the developing market low. The first confirmed positive session that holds the current correction low can begin Rally Attempt Day 1. The objective at this stage is to identify a possible change in market character without prematurely treating the market as being in a confirmed uptrend.
2. RALLY ATTEMPT
Once a Rally Attempt begins, the indicator counts successive trading sessions from Day 1. The attempt fails if the market undercuts the Rally Low according to the selected failure method. By default, the model uses an intraday undercut of the Rally Low as the stricter failure condition, while a close-based alternative is also available. Unlike earlier versions, the script does not impose an arbitrary maximum Rally Day, so a Follow-Through Day may occur on Day 4 or later when the required price and volume conditions are satisfied.
3. CONFIRMED UPTREND
A qualifying Follow-Through Day changes the model state to CONFIRMED UPTREND. When a new FTD occurs, the previous Distribution/Stalling count is reset and a new selling-pressure cycle begins. During a Confirmed Uptrend, the indicator tracks Distribution Days, Stalling-Day approximations, Distribution expiration, 5% recovery/negation, Follow-Through Day age, early post-FTD selling, Follow-Through Day low undercuts and accumulated selling pressure.
DISTRIBUTION DAYS
A Distribution Day is identified when the market declines by at least the configured threshold while volume is greater than the previous session. The default decline threshold is 0.20%. Each Distribution Day is stored independently rather than being managed as part of a simple FIFO counter. A counted Distribution or Stalling event is removed when its configured trading-bar lifetime expires or when the market closes at least the configured recovery percentage above that event's close. The default settings are 25 trading bars for expiration and 5% for recovery/negation. This allows every selling-pressure event to maintain its own independent lifecycle.
STALLING-DAY APPROXIMATION
The Stalling detector is deliberately described as an approximation. It uses publicly described characteristics including a small positive price gain, higher volume than the previous session, a close in the lower portion of the daily range, and recent upward progress during at least one of the previous two sessions. The default settings are a maximum Stalling gain of 0.40%, a maximum close position of 50% of the daily range, and a prior progress requirement of 0.20%.
Complete proprietary Stalling-Day rules are not reconstructed by this script. The indicator therefore does not claim that every orange "S" marker represents an official IBD Stalling Day. Instead, the signal should be interpreted as a public-rule approximation of potential institutional stalling behavior.
FOLLOW-THROUGH DAY
The default Follow-Through Day requirements are:
Rally Day 4 or later
Daily gain of at least 1.25%
Volume greater than the previous session
The price threshold is configurable, and there is no Day 12 cutoff. A qualifying FTD changes the model to Confirmed Uptrend, records the FTD session and Rally Day, records the FTD session low, and resets the Distribution/Stalling count to zero.
FTD LOW UNDERCUT
After a Follow-Through Day, the script can monitor whether a later session trades below the FTD day's low. When this occurs, the indicator generates an FTD LOW warning. By default, an FTD-low undercut is treated as a warning rather than an automatic market-regime change. Users may optionally enable a model rule that resets the state to Correction following an FTD-low undercut. This optional reset is explicitly treated as a model heuristic rather than an official market-status rule.
EARLY POST-FTD WARNING
Selling pressure appearing shortly after a Follow-Through Day can be particularly important. The indicator therefore monitors Distribution and Stalling events occurring inside a configurable early post-FTD window. The default warning window is 5 trading sessions. A selling-pressure event inside this period receives an additional visual warning, helping distinguish ordinary later-stage Distribution from selling that appears almost immediately after a new rally has been confirmed.
MODEL STATES
CORRECTION means no active Rally Attempt has been confirmed and the model continues tracking the developing market low. RALLY ATTEMPT means a potential recovery has begun, but no qualifying Follow-Through Day has yet appeared; the dashboard displays the current Rally Day and Rally Low. CONFIRMED UPTREND means a qualifying Follow-Through Day has occurred and Distribution and Stalling events are now tracked as part of the current selling-pressure cycle.
MODEL PRESSURE
The indicator summarizes accumulated selling pressure during a Confirmed Uptrend. The dashboard displays the active Distribution count, active Stalling approximation count, total selling-pressure count and Model Pressure status. The script also includes an optional transition from Confirmed Uptrend back to Correction after substantial accumulated selling pressure. The default heuristic reset level is 7 active Distribution/Stalling events. This feature is explicitly labeled a heuristic model rule and is not presented as a reconstruction of the official IBD Market Pulse algorithm. The automatic pressure reset can be disabled.
DASHBOARD
The on-chart dashboard summarizes the current model state and important market-direction information, including Timeframe Status, Model State, Rally Attempt Day, Rally Low, Follow-Through Day, FTD Age, Distribution count, Stalling approximation count, Total Pressure, Model Pressure and Last Event.
The dashboard supports nine positions:
Top Left / Top Center / Top Right
Middle Left / Middle Center / Middle Right
Bottom Left / Bottom Center / Bottom Right
Five dashboard text sizes are supported: Tiny, Small, Normal, Large and Huge. The dashboard also includes the attribution CANSLIM Research | canslim.blog.
CONFIRMED-BAR PROCESSING
Market-direction signals are calculated only from confirmed bars. On a Daily chart, this means a Distribution Day, Stalling approximation, Rally Day, Follow-Through Day or FTD-low warning is not finalized until the Daily candle has closed. This helps prevent temporary intraday price or volume conditions from being permanently counted before the trading session is complete.
RECOMMENDED TIMEFRAME
The recommended timeframe is 1 Day. The indicator is specifically designed around daily market-timing concepts. When Require 1D Chart is enabled, signal generation is disabled on other timeframes. The dashboard displays 1D OK when the correct timeframe is being used and USE 1D on an unsupported timeframe.
VOLUME AND DATA LIMITATIONS
This model depends heavily on volume. Different TradingView symbols, exchanges and data vendors can report different volume figures, and index volume in particular may not always represent exactly the same data used by other market-analysis services. For this reason, highly liquid ETF proxies such as SPY or QQQ may sometimes provide more consistent volume behavior than cash index symbols. Users should understand the underlying data source and compare instruments before relying on individual signals.
ALERTS
The indicator includes alert conditions for:
Distribution Day
Stalling approximation
Rally Attempt Day 1
Rally Attempt failure
Follow-Through Day
Early post-FTD selling
FTD Low undercut
Model Correction
Because model events require confirmed bars, alerts are primarily intended for end-of-session market analysis rather than intraday prediction.
IMPORTANT METHODOLOGY LIMITATION
This indicator intentionally separates publicly described methodology from model-specific heuristics. Where a rule can reasonably be represented using publicly described daily OHLCV concepts, the script attempts to implement it directly. Where the full methodology involves proprietary rules, discretionary interpretation, leadership analysis, market context or information unavailable from standard TradingView OHLCV data, the script does not attempt to invent an exact replacement.
This distinction is particularly important for Stalling Days, market-regime transitions, accumulated Distribution interpretation, and broader market leadership and confirmation. The objective is to provide a transparent analytical framework rather than claim an exact reconstruction of a proprietary market-timing system.
VERSION 8.2 RELEASE NOTES
Version 8.2 introduces a major architecture and usability rewrite. The model now uses three explicit market states: Correction, Rally Attempt and Confirmed Uptrend. Follow-Through Day resets the Distribution/Stalling count, the arbitrary Rally Day 12 cutoff has been removed, FTD can qualify on Rally Day 4 or later, and explicit FTD Rally-Day, FTD age and FTD-low tracking have been added.
Rally Attempt state handling has been reworked, including a configurable Rally Low failure method and proper cycle reset following a failed Rally Attempt. Distribution events now maintain independent expiration and 5% recovery/negation levels, while selling pressure is counted only during a Confirmed Uptrend. A new Follow-Through Day begins a fresh Distribution cycle.
The Stalling approximation now includes a prior two-session progress requirement and is explicitly identified as a public-rule approximation rather than an official proprietary detector. Early post-FTD selling warnings and FTD-low undercut warnings have also been added, while the optional FTD-low model reset remains disabled by default.
The model now clearly separates publicly described methodology from configurable heuristics, including the optional Correction reset based on accumulated selling pressure. Signals require confirmed bars to reduce temporary realtime Daily-bar conditions, and Daily-timeframe validation can prevent signal generation outside the intended 1D timeframe.
The dashboard has also been redesigned with nine selectable positions, five text-size levels and CANSLIM Research attribution. Alert conditions have been reorganized to cover the major market-direction events used by the model.
DISCLAIMER
This script is provided for educational, research and analytical purposes only. It is an independent implementation inspired by publicly described William O'Neil / IBD-style market-analysis concepts and is not an official implementation of Investor's Business Daily, MarketSurge, William O'Neil + Co., Dow Jones, or any affiliated methodology or product.
Some elements of the original methodology involve discretionary judgment, market context, leadership behavior, proprietary definitions and data that cannot be reconstructed solely from TradingView OHLCV information. The indicator should therefore not be interpreted as an exact reproduction of any proprietary market-timing system. Past signals do not guarantee future market performance. Nothing produced by this indicator constitutes investment advice, a recommendation to buy or sell securities, or a guarantee of investment results. Users remain solely responsible for their own investment decisions and risk management.
Distribution & Follow-Through Days Counter is an independent Pine Script v6 indicator designed to visualize several publicly described William O'Neil / IBD-style market-timing concepts on daily charts. Rather than displaying isolated signals, the indicator combines Market Correction, Rally Attempt, Follow-Through Day and Distribution analysis into a state-based market-direction model.
OVERVIEW
The model follows three primary market states: CORRECTION, RALLY ATTEMPT and CONFIRMED UPTREND.
1. MARKET CORRECTION
The model begins in a Correction state and tracks the developing market low. The first confirmed positive session that holds the current correction low can begin Rally Attempt Day 1. The objective at this stage is to identify a possible change in market character without prematurely treating the market as being in a confirmed uptrend.
2. RALLY ATTEMPT
Once a Rally Attempt begins, the indicator counts successive trading sessions from Day 1. The attempt fails if the market undercuts the Rally Low according to the selected failure method. By default, the model uses an intraday undercut of the Rally Low as the stricter failure condition, while a close-based alternative is also available. Unlike earlier versions, the script does not impose an arbitrary maximum Rally Day, so a Follow-Through Day may occur on Day 4 or later when the required price and volume conditions are satisfied.
3. CONFIRMED UPTREND
A qualifying Follow-Through Day changes the model state to CONFIRMED UPTREND. When a new FTD occurs, the previous Distribution/Stalling count is reset and a new selling-pressure cycle begins. During a Confirmed Uptrend, the indicator tracks Distribution Days, Stalling-Day approximations, Distribution expiration, 5% recovery/negation, Follow-Through Day age, early post-FTD selling, Follow-Through Day low undercuts and accumulated selling pressure.
DISTRIBUTION DAYS
A Distribution Day is identified when the market declines by at least the configured threshold while volume is greater than the previous session. The default decline threshold is 0.20%. Each Distribution Day is stored independently rather than being managed as part of a simple FIFO counter. A counted Distribution or Stalling event is removed when its configured trading-bar lifetime expires or when the market closes at least the configured recovery percentage above that event's close. The default settings are 25 trading bars for expiration and 5% for recovery/negation. This allows every selling-pressure event to maintain its own independent lifecycle.
STALLING-DAY APPROXIMATION
The Stalling detector is deliberately described as an approximation. It uses publicly described characteristics including a small positive price gain, higher volume than the previous session, a close in the lower portion of the daily range, and recent upward progress during at least one of the previous two sessions. The default settings are a maximum Stalling gain of 0.40%, a maximum close position of 50% of the daily range, and a prior progress requirement of 0.20%.
Complete proprietary Stalling-Day rules are not reconstructed by this script. The indicator therefore does not claim that every orange "S" marker represents an official IBD Stalling Day. Instead, the signal should be interpreted as a public-rule approximation of potential institutional stalling behavior.
FOLLOW-THROUGH DAY
The default Follow-Through Day requirements are:
Rally Day 4 or later
Daily gain of at least 1.25%
Volume greater than the previous session
The price threshold is configurable, and there is no Day 12 cutoff. A qualifying FTD changes the model to Confirmed Uptrend, records the FTD session and Rally Day, records the FTD session low, and resets the Distribution/Stalling count to zero.
FTD LOW UNDERCUT
After a Follow-Through Day, the script can monitor whether a later session trades below the FTD day's low. When this occurs, the indicator generates an FTD LOW warning. By default, an FTD-low undercut is treated as a warning rather than an automatic market-regime change. Users may optionally enable a model rule that resets the state to Correction following an FTD-low undercut. This optional reset is explicitly treated as a model heuristic rather than an official market-status rule.
EARLY POST-FTD WARNING
Selling pressure appearing shortly after a Follow-Through Day can be particularly important. The indicator therefore monitors Distribution and Stalling events occurring inside a configurable early post-FTD window. The default warning window is 5 trading sessions. A selling-pressure event inside this period receives an additional visual warning, helping distinguish ordinary later-stage Distribution from selling that appears almost immediately after a new rally has been confirmed.
MODEL STATES
CORRECTION means no active Rally Attempt has been confirmed and the model continues tracking the developing market low. RALLY ATTEMPT means a potential recovery has begun, but no qualifying Follow-Through Day has yet appeared; the dashboard displays the current Rally Day and Rally Low. CONFIRMED UPTREND means a qualifying Follow-Through Day has occurred and Distribution and Stalling events are now tracked as part of the current selling-pressure cycle.
MODEL PRESSURE
The indicator summarizes accumulated selling pressure during a Confirmed Uptrend. The dashboard displays the active Distribution count, active Stalling approximation count, total selling-pressure count and Model Pressure status. The script also includes an optional transition from Confirmed Uptrend back to Correction after substantial accumulated selling pressure. The default heuristic reset level is 7 active Distribution/Stalling events. This feature is explicitly labeled a heuristic model rule and is not presented as a reconstruction of the official IBD Market Pulse algorithm. The automatic pressure reset can be disabled.
DASHBOARD
The on-chart dashboard summarizes the current model state and important market-direction information, including Timeframe Status, Model State, Rally Attempt Day, Rally Low, Follow-Through Day, FTD Age, Distribution count, Stalling approximation count, Total Pressure, Model Pressure and Last Event.
The dashboard supports nine positions:
Top Left / Top Center / Top Right
Middle Left / Middle Center / Middle Right
Bottom Left / Bottom Center / Bottom Right
Five dashboard text sizes are supported: Tiny, Small, Normal, Large and Huge. The dashboard also includes the attribution CANSLIM Research | canslim.blog.
CONFIRMED-BAR PROCESSING
Market-direction signals are calculated only from confirmed bars. On a Daily chart, this means a Distribution Day, Stalling approximation, Rally Day, Follow-Through Day or FTD-low warning is not finalized until the Daily candle has closed. This helps prevent temporary intraday price or volume conditions from being permanently counted before the trading session is complete.
RECOMMENDED TIMEFRAME
The recommended timeframe is 1 Day. The indicator is specifically designed around daily market-timing concepts. When Require 1D Chart is enabled, signal generation is disabled on other timeframes. The dashboard displays 1D OK when the correct timeframe is being used and USE 1D on an unsupported timeframe.
VOLUME AND DATA LIMITATIONS
This model depends heavily on volume. Different TradingView symbols, exchanges and data vendors can report different volume figures, and index volume in particular may not always represent exactly the same data used by other market-analysis services. For this reason, highly liquid ETF proxies such as SPY or QQQ may sometimes provide more consistent volume behavior than cash index symbols. Users should understand the underlying data source and compare instruments before relying on individual signals.
ALERTS
The indicator includes alert conditions for:
Distribution Day
Stalling approximation
Rally Attempt Day 1
Rally Attempt failure
Follow-Through Day
Early post-FTD selling
FTD Low undercut
Model Correction
Because model events require confirmed bars, alerts are primarily intended for end-of-session market analysis rather than intraday prediction.
IMPORTANT METHODOLOGY LIMITATION
This indicator intentionally separates publicly described methodology from model-specific heuristics. Where a rule can reasonably be represented using publicly described daily OHLCV concepts, the script attempts to implement it directly. Where the full methodology involves proprietary rules, discretionary interpretation, leadership analysis, market context or information unavailable from standard TradingView OHLCV data, the script does not attempt to invent an exact replacement.
This distinction is particularly important for Stalling Days, market-regime transitions, accumulated Distribution interpretation, and broader market leadership and confirmation. The objective is to provide a transparent analytical framework rather than claim an exact reconstruction of a proprietary market-timing system.
VERSION 8.2 RELEASE NOTES
Version 8.2 introduces a major architecture and usability rewrite. The model now uses three explicit market states: Correction, Rally Attempt and Confirmed Uptrend. Follow-Through Day resets the Distribution/Stalling count, the arbitrary Rally Day 12 cutoff has been removed, FTD can qualify on Rally Day 4 or later, and explicit FTD Rally-Day, FTD age and FTD-low tracking have been added.
Rally Attempt state handling has been reworked, including a configurable Rally Low failure method and proper cycle reset following a failed Rally Attempt. Distribution events now maintain independent expiration and 5% recovery/negation levels, while selling pressure is counted only during a Confirmed Uptrend. A new Follow-Through Day begins a fresh Distribution cycle.
The Stalling approximation now includes a prior two-session progress requirement and is explicitly identified as a public-rule approximation rather than an official proprietary detector. Early post-FTD selling warnings and FTD-low undercut warnings have also been added, while the optional FTD-low model reset remains disabled by default.
The model now clearly separates publicly described methodology from configurable heuristics, including the optional Correction reset based on accumulated selling pressure. Signals require confirmed bars to reduce temporary realtime Daily-bar conditions, and Daily-timeframe validation can prevent signal generation outside the intended 1D timeframe.
The dashboard has also been redesigned with nine selectable positions, five text-size levels and CANSLIM Research attribution. Alert conditions have been reorganized to cover the major market-direction events used by the model.
DISCLAIMER
This script is provided for educational, research and analytical purposes only. It is an independent implementation inspired by publicly described William O'Neil / IBD-style market-analysis concepts and is not an official implementation of Investor's Business Daily, MarketSurge, William O'Neil + Co., Dow Jones, or any affiliated methodology or product.
Some elements of the original methodology involve discretionary judgment, market context, leadership behavior, proprietary definitions and data that cannot be reconstructed solely from TradingView OHLCV information. The indicator should therefore not be interpreted as an exact reproduction of any proprietary market-timing system. Past signals do not guarantee future market performance. Nothing produced by this indicator constitutes investment advice, a recommendation to buy or sell securities, or a guarantee of investment results. Users remain solely responsible for their own investment decisions and risk management.
Notes de version
Update ChartsNotes de version
Release Notes: Version 8.4 - UI & Marker Positioning OverhaulThis update focuses on drastically improving chart clarity, completely eliminating marker overlap, and giving you full control over where signals appear relative to your price bars and moving averages.
What's New in v8.4:
No More Overlapping Labels: Replaced the bulky, background-shaded label boxes with clean, minimal single-character text markers (D, S, R, F, etc.). This completely eliminates horizontal overlap when signals cluster closely together.
Dynamic Price-Tracking Markers: Markers no longer form a crowded straight line at the absolute top or bottom of the pane. They now track the curve of the price action, placing themselves dynamically above the high or below the low of the signal bar.
Manual Offset Adjustments (New Settings): Added "Top Marker Offset" and "Bottom Marker Offset" to the visual settings. These use an adjustable ATR (Average True Range) multiplier, allowing you to manually push the signal markers higher or lower to perfectly clear your moving averages and price bars.
Cleaner Defaults: Background signal shading is now disabled by default to provide a cleaner chart right out of the box (can easily be re-enabled in settings).
All core market direction, stalling, and distribution counting logic remains unchanged.

Clause de non-responsabilité
Les informations et publications ne sont pas destinées à être, et ne constituent pas, des conseils ou recommandations financiers, d'investissement, de trading ou autres fournis ou approuvés par TradingView. Pour en savoir plus, consultez les Conditions d'utilisation.
Clause de non-responsabilité
Les informations et publications ne sont pas destinées à être, et ne constituent pas, des conseils ou recommandations financiers, d'investissement, de trading ou autres fournis ou approuvés par TradingView. Pour en savoir plus, consultez les Conditions d'utilisation.