OPEN-SOURCE SCRIPT
Mis à jour MTF Pivot+ (Camarilla & CPR)
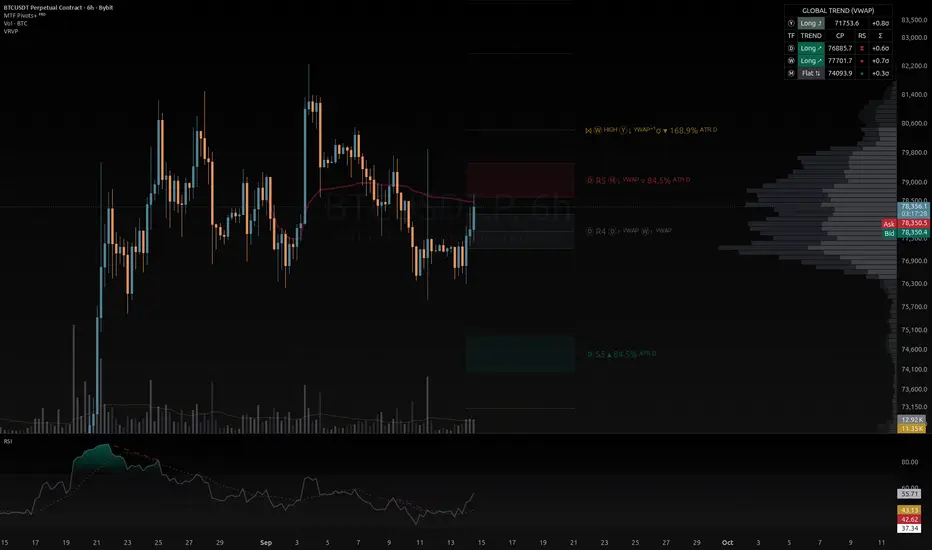
MTF Pivot+ is an advanced indicator that combines Camarilla levels and Central Pivot Range (CPR) zones with multi-timeframe (MTF) analysis. It equips traders with a powerful toolkit to identify key support and resistance zones, analyze market trends, and pinpoint precision entry areas for both day trading and swing trading!
Key Features:
⚠️ Disclaimer:
This indicator is provided solely for educational and informational purposes. It does not constitute financial, investment, or trading advice.
Please keep the following important points in mind:
Key Features:
- ⏱️ Smart Auto-Timeframe: Automatically selects the optimal higher timeframe for calculating levels based on your current chart (e.g., Daily levels for intraday charts up to 30m).
- 🎯 Central Pivot Range (CPR): Displays the CPR zone (CP, BC, TC) with built-in trend analysis. The zone automatically changes color depending on its shift relative to the previous period (bullish, bearish, or flat).
- 📊 Camarilla Pivot Levels: Comprehensive calculation of internal levels (R1-R2 / S1-S2), key reversal zones (R3 / S3), breakout extremes (R4 / S4), and extended targets (R5-R6 / S5-S6).
- 🔄 Dynamic (Rolling) Pivots: Option to calculate levels from the previous day's close for daily dynamic updates, while still maintaining the true highs and lows of the higher timeframe.
- 💱 Advanced Futures Support: Seamlessly use continuous contracts and calculate pivots based on the Last Traded Price (LTP) instead of exchange settlement prices.
- 🎛️ MTF Dashboard: A compact, sleek on-chart panel showing the current price's position relative to the Central Pivot (CP) across Daily, Weekly, and Monthly timeframes at a single glance.
- 🔔 Comprehensive Alerts System: Built-in alerts with a smart "cooldown" feature for CPR crosses, touches of reversal zones, R4/S4 breakouts, and previous period High/Low breaches.
- 🎨 Highly Customizable: Easily toggle specific levels or features on/off (for example, enabling HLC mode hides main levels) to keep your charts clean, focused, and informative!
⚠️ Disclaimer:
This indicator is provided solely for educational and informational purposes. It does not constitute financial, investment, or trading advice.
Please keep the following important points in mind:
- High Risks: Trading in financial markets (cryptocurrencies, forex, stocks, futures) involves a high level of risk and may result in the partial or total loss of your capital.
- No Guarantees: Indicators are based on the mathematical analysis of past price data. Past price movements and successful level tests do not guarantee future profits.
- Do Your Own Research (DYOR): Never make trading decisions based solely on the readings of a single indicator. Always conduct your own comprehensive market analysis, consider the overall context, and employ strict risk management.
- Responsibility: You use this script entirely at your own risk.
Notes de version
Updated the chart component to match TradingView guidelines and requirements.Notes de version
⚡ ATR Exhaustion Filter (⚡ marker): visually marks levels statistically unlikely to be reached in the current period (distance > ATR × multiplier from open). Configurable period, multiplier and timeframe (Daily / Pivot TF). The ⚡ icon appears even when main labels are disabled, serving as a standalone visual signal.Notes de version
Minor Bug Fixes...Notes de version
The Volatility Exhaustion Filter has been refined for maximum trading reliability. What’s new:- Session memory added: The indicator now reliably tracks whether levels have already been fulfilled. Once a level is reached, it is marked as completed for the rest of the session, preventing any false repeat signals.
- New visual markers: Active exhaustion zones are now highlighted with triangles (▲/▼), while zones where liquidity has already been taken are marked with checkmarks (✓).
- Improved stability: Label flickering on the chart has been eliminated. You now get a clear level status at all times: “Active Target” or “Completed Level.”
Notes de version
Now, exhaustion markers (▼/▲) show the exact level of overextension as a % of the raw ATR. How to read: The marker ▼ (120% of ATR) means that to reach this level, the price had to overcome 120% of its average historical move.Notes de version
Minor Bug Fixes...Notes de version
🧩 MTF Level Confluence: The indicator now automatically scans higher timeframes — Daily (1D), Weekly (1W), and Monthly (1M) — to detect overlapping key price levels.- How it works: If a key level on the current timeframe aligns with a level from a higher timeframe within a defined tolerance (for example, 0.1%), a corresponding symbol is automatically added to the label: Ⓓ, Ⓦ, or Ⓜ, along with the level name (e.g., Ⓓ R3).
- Why it matters: Multi-timeframe confluence highlights major institutional support and resistance zones that are closely monitored by institutional traders and large market participants.
- Availability: Confluence detection is enabled only for key levels (CPR, Pivot Zones R3/S3, and Extreme Levels R4/S4) and only in the Current display mode. Intermediate and distant target levels are intentionally excluded to keep the chart clean and readable.
🛠 Technical Updates & Optimization: The codebase has been fully modernized to Pine Script v6 standards for improved stability and performance.
- Resource Efficiency: Implemented lazy data loading — when Confluence or ATR features are disabled in the settings, the script avoids unnecessary request.security() calls, reducing resource usage and ensuring fast chart loading.
Notes de version
Logical fix: MTF Confluence search is now automatically disabled in Rolling mode to prevent conflicts between dynamic and static levels.Notes de version
Minor Bug Fixes...Notes de version
- 🛠 ATR Exhaustion: Fixed a calculation error that occurred when using the Daily ATR on higher timeframe charts (Weekly/Monthly). Added built-in protection against desynchronization: the indicator now safely disables markers and displays a warning panel on the screen with setup hints.
- ⚡️ Code Optimization: The code has been cleaned of unnecessary calculations so the indicator runs faster and doesn't overload the chart, while also organizing the settings menu and tooltips.
Notes de version
- 🧩 MTF Confluence: Added confluence search for higher timeframe extremes (High/Low). They are given top priority and displayed on the chart as Ⓦ High or Ⓜ Low.
Notes de version
Minor Bug Fixes...Notes de version
- 📈 Anchored VWAP and Level Confluence: Added a dynamic VWAP line anchored to the start of the current pivot period (daily, weekly, or monthly). The indicator now searches for confluences between key levels and higher TF VWAPs, displaying them with special markers: Ⓓ VWAP (exact match), Ⓓ ↓ VWAP (line is below the level), and Ⓓ ↑ VWAP (line is above the level). Added alerts for price crossing the VWAP line.
- 🛠 Technical Improvements: Optimized the code to enhance the stability of the indicator.
Notes de version
- 📈 Yearly VWAP: Added a new dynamic line anchored to January 1st of the current year to assess the global market context.
- 🛠 Technical Fixes: Optimized the code to improve overall stability.
Notes de version
- 🎯 Target Levels: Included R4.5-R5 and S4.5-S5 into the existing MTF Confluence analysis.
- 🛠 Optimization: Applied rendering engine improvements and query consolidation to lower CPU overhead and enhance stability.
Notes de version
- 🏅 Synergy Score ⋈: Quantitative level significance. The ⋈ icon appears only at high‑confidence zones (D/W/M pivots, VWAP, ATR exhaustion). Built‑in false‑signal protection: must‑have W/M/Y, single‑TF contribution cap (50%), ATR saturation.
- 🎯 Nearest Neighbor: Exclusive capture - if multiple levels fall within the same higher‑TF tolerance, the marker appears only on the closest one (pivots & VWAP). Previously, confluence markers could duplicate on clustered levels.
- 🗓️ Yearly VWAP: now integrated into the confluence matrix. Participates in matching and Synergy Score with its own weight (Y = 3.5). Works alongside daily, weekly, and monthly VWAP.
- 🥸 Tolerance presets: Added presets for MTF Confluence, tailored for different asset classes – from stocks to altcoins.
- 📝 Interface improvements: Revised UI labels, groups, tooltips, and alerts for better clarity and usability.
- ⚡️ Optimisation: request.security calls reduced from 12+ → 9. Unified fetch function for D/W/M, combined ATR and history queries.
Notes de version
Minor Bug Fixes...Notes de version
Minor Bug Fixes...Notes de version
Updated Tooltips...Notes de version
Minor Bug Fixes...Notes de version
🧬 Anchor Time Dedup: Added protection in the Synergy Score against double-counting the same VWAP signal when the day, week, and month all reset on the same bar.💱 Forex/CFD: Fixed VWAP calculation on no-volume instruments — now correctly detected by asset type instead of a single bar's value.
⏱ CME Session Sync: With Last Traded Price (LTP) enabled, ATR now uses the same session as the pivots — eliminated a multi-hour desync.
🛡 Dual Stale-Pivot Protection: Added a check against the pivot period's actual scheduled close time — works even on futures with a full weekend market closure.
🎯 Yearly VWAP Bands & Alerts: Added standard deviation bands (±1σ, ±2σ, ±3σ) for the yearly VWAP, including MTF confluence integration and dedicated breakout alerts.
📐 Yearly VWAP Precision: Implemented a numerically stable variance algorithm (Welford-West) for the ±1σ/±2σ/±3σ bands.
🛠 Technical Fixes: Updated markers, tooltip text, and minor wording corrections.
Notes de version
Minor Bug Fixes...Notes de version
Minor Bug Fixes...Notes de version
🚀 New Features- Enhanced MTF Dashboard: 5 trend states (Impulse ↗/↘, Pullback ⤴/⤵, Flat ⇅) determined by VWAP direction and price position relative to the CPR zone.
- Overheat Indicator (Σ): New dashboard column showing price or CP deviation from the Annual VWAP in standard deviations (σ). Adds a ⚠ marker and red highlight for >2σ deviation.
- ATR Base Labels: Exhaustion markers now explicitly show the calculation base: ᴰ (Daily) or ᴾ (Pivot-based).
⚡ Improvements & Optimization
- VWAP Stability: Calculation is now routed through request.security with a fixed base (15m for D/W/M, 60m for Y). This completely eliminates value jumps when changing the chart timeframe.
- Memory Optimization: Added point deduplication for VWAP polyline rendering. Prevents hitting the 10,000-point array limit on lower timeframes.
- Negative Value Protection: Support levels (S1–S5) that calculate below zero are now safely hidden (na), preventing chart scale distortion.
- Volatility Limiter: Added MAX_R5_HL_RATIO = 5.0 to protect the R5 level from anomalous values during extreme gaps or data glitches.
🐛 Bug Fixes
- MTF Confluence: Fixed a critical bug that caused duplicate confluence markers when different levels (e.g., R3 and CP) accidentally matched in price on a flat/degenerate bar.
- VWAP Alerts: Added protection against false triggers on the exact bar of an anchor reset (start of a new day/week/year).
- Touch Alerts (S3/R3/S4/R4/High/Low): Logic rewritten to track touch transitions (false → true). Guarantees exactly 1 notification per touch with accurate cooldown handling.
- Synergy (⋈): The badge now automatically hides on 1W+ charts, as applying a daily ATR gate on higher timeframes is logically invalid.
🎨 UI / Interface
- Tooltips: Updated and clarified for all settings.
- Improved chart cleanup logic: lines and labels now disappear instantly without visual artifacts when the timeframe is incompatible or the Kill Switch is triggered.
Notes de version
- ● RS column in the MTF Dashboard: a colored dot duplicating the "CPR Shift (CPR Relationship)" feature for each row (Ⓓ/Ⓦ/Ⓜ), showing that timeframe's Central Pivot shift versus its previous period.
Notes de version
- ⧗ Narrow CPR marker (Ⓓ row): the RS dot switches to ⧗ when today's Daily CPR is narrower than 80% of the last 200 completed daily bars for that instrument; the threshold self-calibrates per ticker via a rolling percentile.
- 📏 HLC reference lines ("Previous" mode): now extend all the way to the end of the current period instead of stopping at the end of the previous one, with labels correctly repositioned to match.
- 🎨 Dashboard panel: removed unnecessary transparency and refined the color palette (background, header row, trend-state backgrounds) for better readability.
Notes de version
Minor Bug Fixes...Notes de version
- 🧭 "Off" in "Pivot Calculation Period": fully disables Camarilla/CPR levels, MTF Confluence, ATR Exhaustion, Synergy Score, and level-based alerts; the MTF Dashboard and Anchored VWAP (including its alerts) keep working without restrictions — handy if you only need the indicator as a trend panel or a VWAP tool.
Notes de version
- 🔔 R4.5/S4.5 and R5/S5 touch alerts: same mechanics as R3/S3 and R4/S4, separate toggles (off by default), only work with pivots enabled.
Notes de version
🐛 Bug Fixes:- 🧩 MTF Confluence — closest-target selection: if your level fell within tolerance of several higher-TF levels at once (e.g., both S4 and S4.5), the marker used to show whichever was checked first in a fixed order, not the actually closest one. Now the numerically closest level always wins, with no internal hierarchy by type.
- 🧩 MTF Confluence — own-TF High/Low now included: with Weekly pivots selected, confluence with the actual High/Low of last week wasn't checked at all before (it was mistakenly suppressed together with the weekly pivots, to avoid comparing a level to itself). Now the same TF's own High/Low participates in confluence as normal — calculated pivots of the same TF still aren't compared against themselves.
Notes de version
Minor Bug Fixes...Notes de version
What's new:- 📐 Camarilla Multiplier: Added a new setting to adapt the level grid to market volatility (presets ranging from the classic 1.1 standard to 1.618). In the classic mode (1.1), the extreme R5/S5 levels are calculated using the original Murrey math formula, while for all other multipliers, a linear progression is automatically applied to maintain the symmetry of the grid.
Notes de version
Update tooltips...Notes de version
Minor Bug Fixes...Script open-source
Dans l'esprit TradingView, le créateur de ce script l'a rendu open source afin que les traders puissent examiner et vérifier ses fonctionnalités. Bravo à l'auteur! Bien que vous puissiez l'utiliser gratuitement, n'oubliez pas que la republication du code est soumise à nos Règles.

Clause de non-responsabilité
Les informations et publications ne sont pas destinées à être, et ne constituent pas, des conseils ou recommandations financiers, d'investissement, de trading ou autres fournis ou approuvés par TradingView. Pour en savoir plus, consultez les Conditions d'utilisation.
Script open-source
Dans l'esprit TradingView, le créateur de ce script l'a rendu open source afin que les traders puissent examiner et vérifier ses fonctionnalités. Bravo à l'auteur! Bien que vous puissiez l'utiliser gratuitement, n'oubliez pas que la republication du code est soumise à nos Règles.
Clause de non-responsabilité
Les informations et publications ne sont pas destinées à être, et ne constituent pas, des conseils ou recommandations financiers, d'investissement, de trading ou autres fournis ou approuvés par TradingView. Pour en savoir plus, consultez les Conditions d'utilisation.